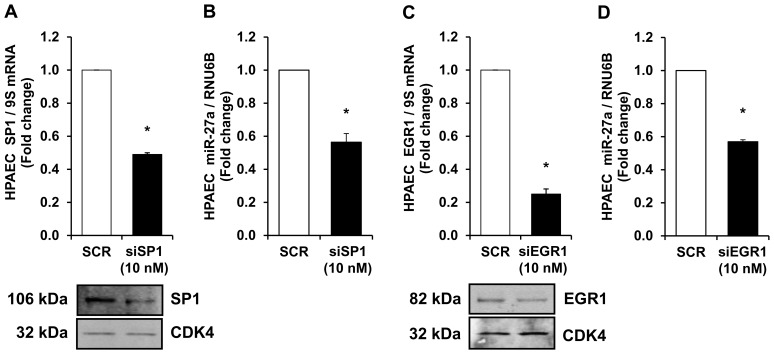
Figure 7. Knockdown of transcription factors, SP1 and EGR1, attenuates miR-27a expression.
HPAEC were treated with 10(SCR) or siRNA duplexes to SP1 or EGR1 for 72 hours. HPAEC mRNA or proteins were then isolated. qRT-PCR was performed demonstrating decreases in SP1 (A) or EGR1 (C) mRNA levels following treatment with siRNA. Each bar represents the mean ± SE SP1 or EGR1 relative to 9S in the same sample expressed as fold-change vs. cells treated with scrambled siRNA (SCR). n = 3, *p<0.05 vs. SCR. Western blotting was employed to detect SP1 (A) or EGR1 (C) protein levels. Representative blots depicting SP1 or EGR1 protein depletion in siRNA-treated HPAEC is shown. n = 3, *p<0.05 vs. SCR. HPAECs were treated with SCR or siRNA duplexes to SP1 or EGR1, and miRNA was isolated and subjected to qRT-PCR analysis along with RNU6B. Each bar represents the mean ± SE miR-27a relative to RNU6B expressed as fold change vs. SCR. n = 3, *p<0.05 vs. SCR. miR-27a levels were downregulated following SP1 (B) or EGR1 (D) depletion in HPAECs.

