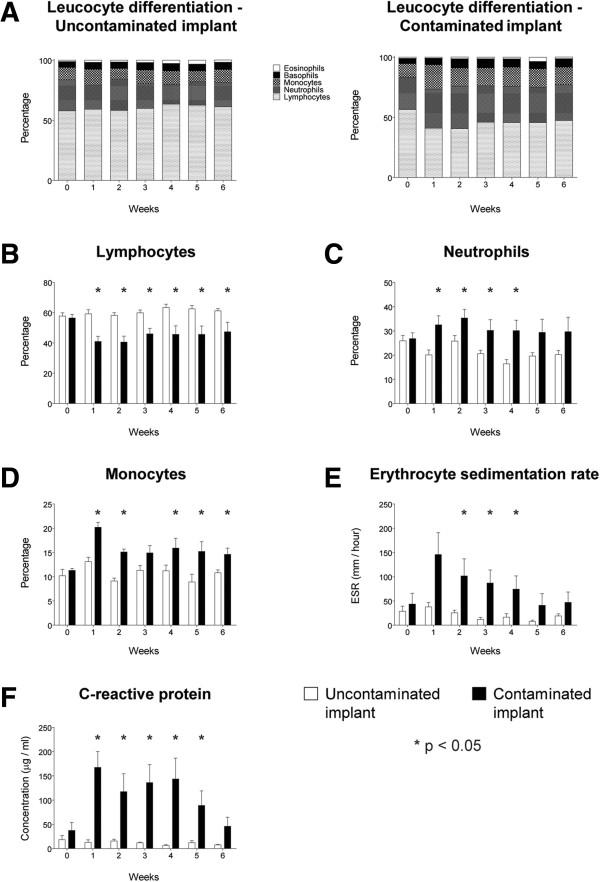
Figure 4.
Haematological parameters. (A) Summary of the leucocyte differentiation. (B) Percentage of lymphocytes. (C) Percentage of neutrophils. (D) Percentage of monocytes. (E) Erythrocyte sedimentation rate. (F) The C-reactive protein levels. White bars represent the control population while black bars represent the contaminated implant group. Error bars represent the standard error of the mean. Asterisk indicates p < 0.05.

