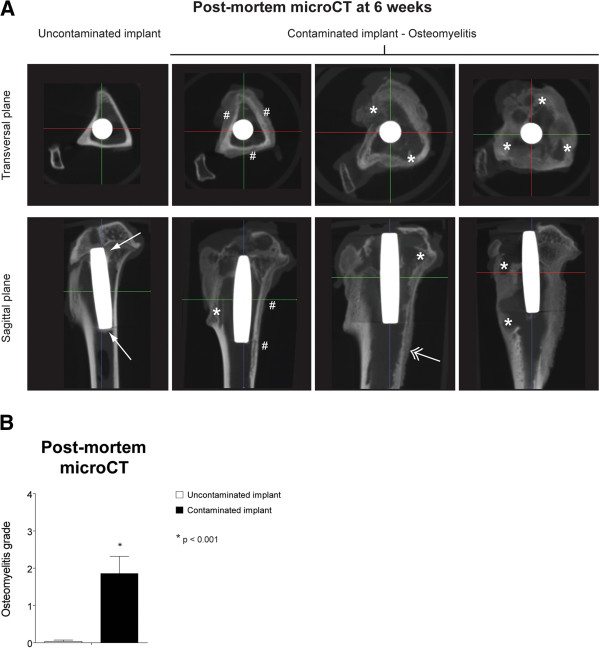
Figure 6.
Quantitative radiological ex vivo imaging. (A) Representative post-mortem micro-CT images taken after the 6-week follow-up. The hash sign indicates calcification of the periosteal reaction, the asterisk indicates osteolysis, the solid arrow points at bone apposition at the implant surface and the double-headed arrow indicates the presence of an involucrum. (B) Quantification of the micro-CT images allows differentiation between the control group (white bar) and the implant infection group (black bar). Error bars represent the standard error of the mean. Asterisk indicates p < 0.001.

