Figure 7.

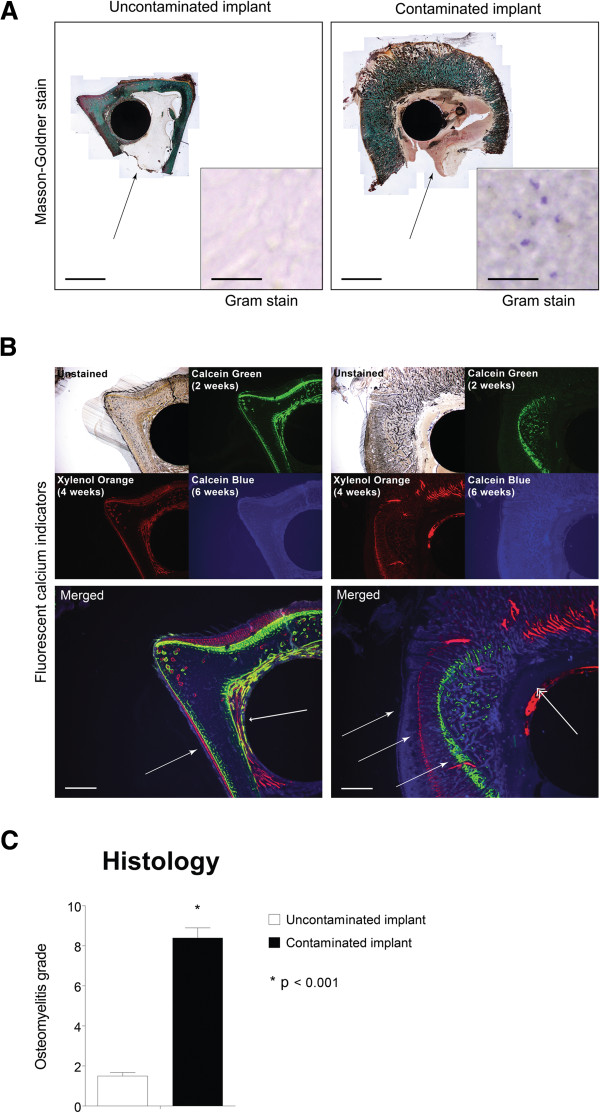
Quantitative histology. (A) Histological sections of the distal part of the implant region. Sections show distinctive morphological changes in the contaminated implant group, with bone apposition on the implant surface in the uncontaminated implant group and cortical thickening in the contaminated implant group. Black arrow indicates an intramedullary abscess (bars represent 4 mm). Gram staining (insert) shows Gram-positive cells in the contaminated implant group while the uncontaminated group remains negative (bars represent 20 μm). (B) Fluorescent calcium indicators represent calcium deposition at the time of injection, indicating bone development (large arrowhead) and implant ingrowth (small arrowhead) in the uncontaminated implant group. In the contaminated implant group, these indicators point at calcification of the periosteum due the periosteal elevation (three identical white arrows) caused by the presence of bacteria. The double arrowhead indicates osteolysis in the peri-implant tissue (bars represent 1 mm). (C) Quantification of the histological symptoms of implant infection shows a distinct, significant difference between the control group (white bar) and the infected implant group (black bar). Error bars represent the standard error of the mean. Asterisk indicates p < 0.001.
