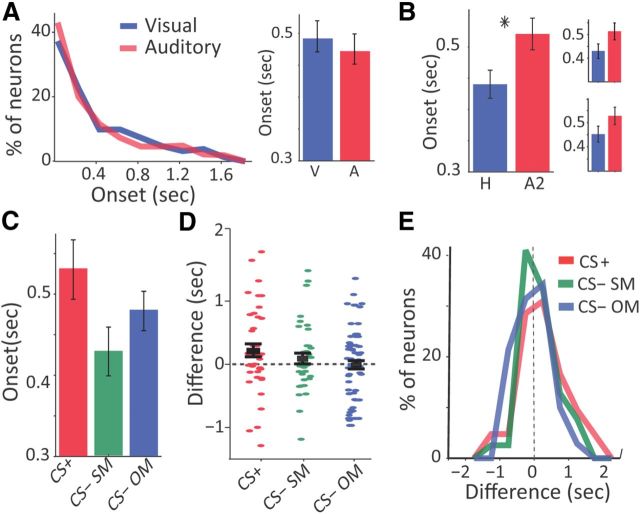
Figure 6.
Onset of responses. A, Distribution of onsets for neural responses from all responsive neurons, separately for auditory and visual sessions. Mean ± SEM shown to the right. B, Onsets mean ± SEM during habituation (H) and late acquisition (A2). Insets in the right show the same separately for auditory and visual sessions. C, Onsets mean ± SEM for the different CS types (averaged over H and A2). D, The difference between onsets of responding neurons at acquisition and habituation for the different CS types. Shown in black is mean ± SEM. E, Distribution of onset differences (same data as in D). Whereas onsets were delayed after learning (C), potentially reflecting the learned delay (trace interval and/or CS duration), there were little differences between CS types and modalities (see Results, Characteristics of neural responses to the different CSs, for statistics).

