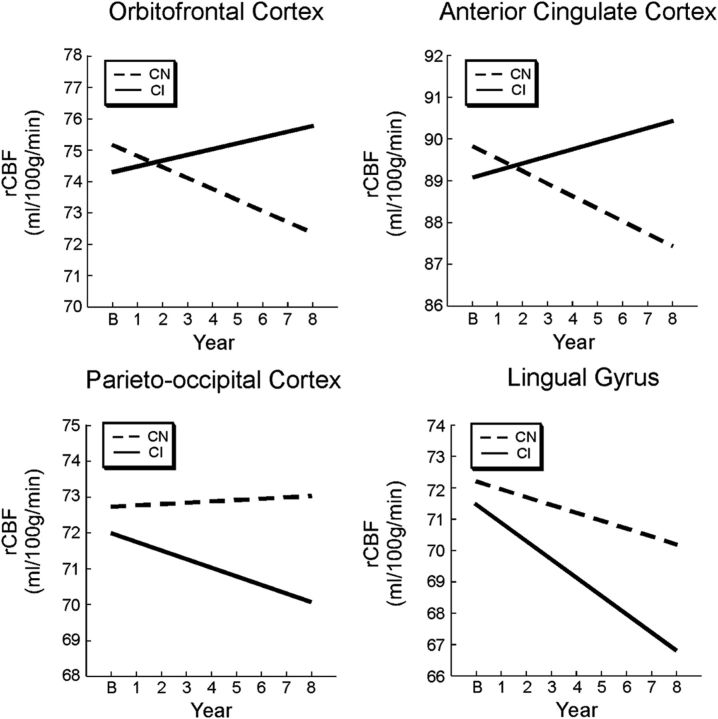
Figure 4.
Regional trajectories of rCBF change. The CI group shows different trajectories of rCBF of change over time relative to the CN group. Estimated trajectories of longitudinal change are shown for regions of greater rCBF increase in the CI group (orbitofrontal and anterior cingulate regions) and greater rCBF decrease in the CI group (parieto-occipital and lingual regions). All changes were linear in nature.

