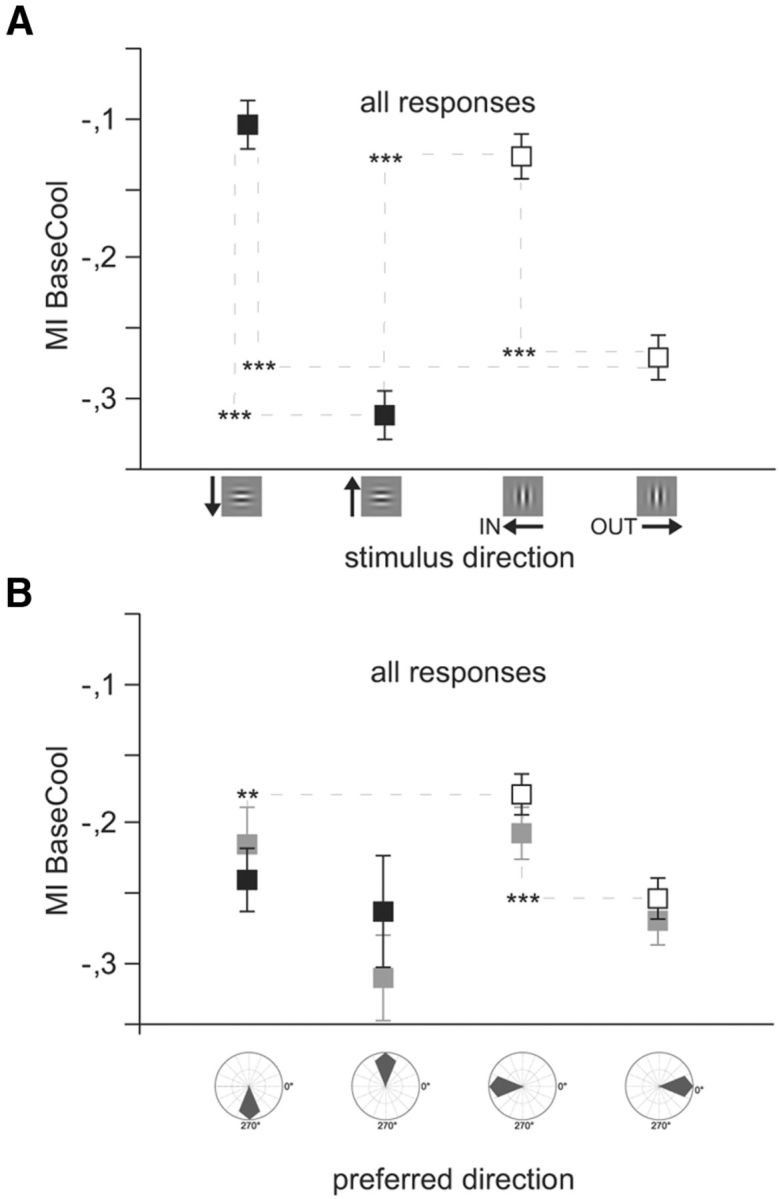
Figure 6.

Both projecting and receiving structures exhibit selectivity. Nonpreferred responses: Average modulation indices for all significant responses (n = 902) to the four Gabor patches, including HN and VN and neurons not preferring cardinal directions (NPN). Conventions as in Figure 4. The influence of stimulus direction (A) and the cell's individual direction preference (B) on modulation indices during cooling are compared. A, MIs during visual stimulation with isolated Gabor patches moving in different directions. Responses are grouped according to the stimulus direction. B, Responses are grouped according to the quadrant of the unit's preference direction (right, 316–45°; upward, 46–135°; left, 136–225°; downward, 226–315°). Light gray squares represent prestimulus activity. Both input (visual stimulus) and the receiving neurons' preference matter. Error bars and significance levels as in Figure 2.
