
Figure 3.
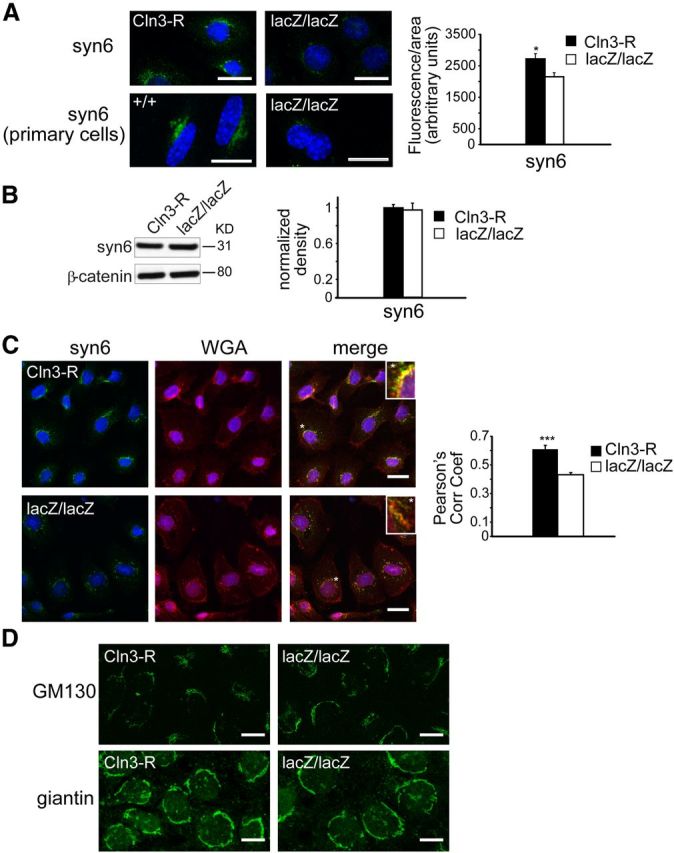
CLN3 promotes normal trafficking of syntaxin 6. A, CLN3-expressing and nonexpressing endothelial cells were stained for syntaxin-6 (syn6) and analyzed by confocal microscopy. Cell nuclei (blue dye) are shown. Scale bars, 20 μm. Fluorescence intensity was quantified in MBECs. Bars show the mean ± SEM for each group (*p < 0.05, 32 cells analyzed per group). B, SDS-PAGE and immunoblot analyses for syntaxin-6 was performed as in Figure 2. Bars show mean ± SEM of four experiments. C, Colocalization analyses for syntaxin-6 (green) and WGA (red) in CLN3-deficient (lacZ/lacZ) or restored (Cln3-R) MBECs. Cell nuclei were stained with Hoechst dye (blue). Pearson's correlation coefficients were calculated for red/green channels for lacZ/lacZ and Cln3-R MBECs and bars show mean ± SEM (***p < 0.001, 32 cells per group). All fluorescence quantifications were performed using ImageJ software. D, MBEClacZ/lacZ and MBECCln3-R cells were immunofluorescently stained for cis-Golgi markers GM-130 or giantin. Representative confocal images are shown. Scale bar, 10 μm.