
Figure 4.
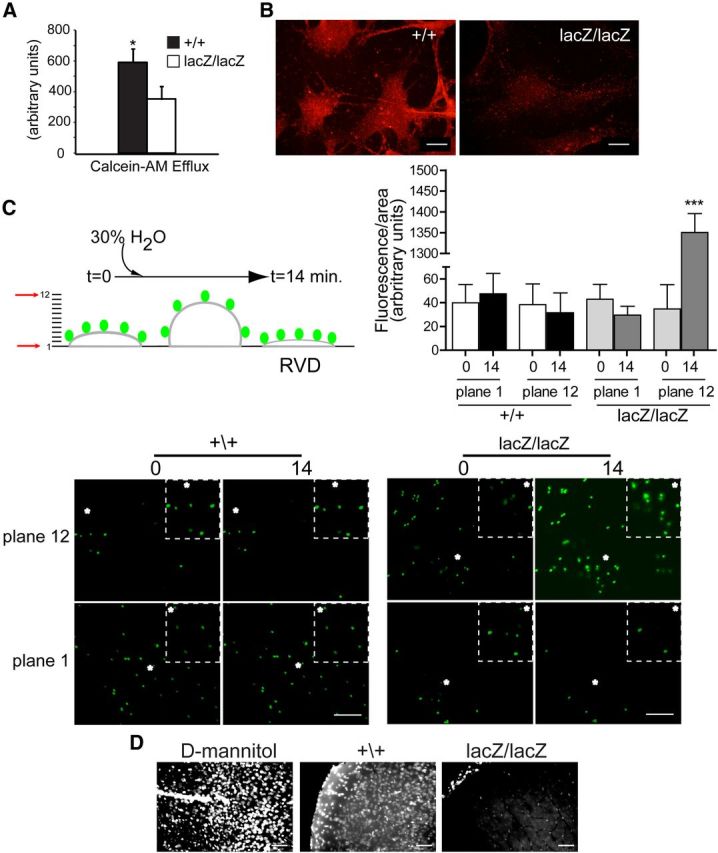
CLN3 is necessary for normal drug efflux and cell volume regulation in brain endothelial cells. A, MBECs were loaded with calcein-AM and efflux was determined by measuring decrease in intracellular fluorescence after 1 h. Bars shown mean ± SEM drop in fluorescence (*p < 0.05, n = 3 independent experiments). B, MBECs were immunofluorescently stained for MDR1 and analyzed by confocal microscopy. Settings for image capture were identical between compared cell types. Representative images are shown. Scale bar, 20 μm. C, Apical membranes of primary brain endothelial cultures were labeled with 1.0 μm diameter FluoSpheres and confocal z-series images were collected through the depth of the monolayer, under isotonic starting conditions (time 0) and after hypotonic challenge (30% water). Fluorescence intensity was quantified in focal planes 1 and 12 at time 0, and after 14 min using ImageJ software and bars show mean ± SEM (***p < 0.001). D, Cln3+/+ and Cln3lacZ/lacZ mice were given an intracarotid injection of hypotonic tracer (Hoechst 33258) and killed 30 min later. For positive controls for BBB disruption, Cln3+/+ mice were given d-mannitol (i.p. 20% mannitol in isotonic saline) 10 min before an intracarotid injection of isotonic tracer (labeled as D-mannitol). Brains were analyzed by fluorescence microscopy (n = 7 mice per group). Settings for image capture and for image adjustment (MetaMorph software) were identical between groups. Representative images from cerebral cortex are shown.