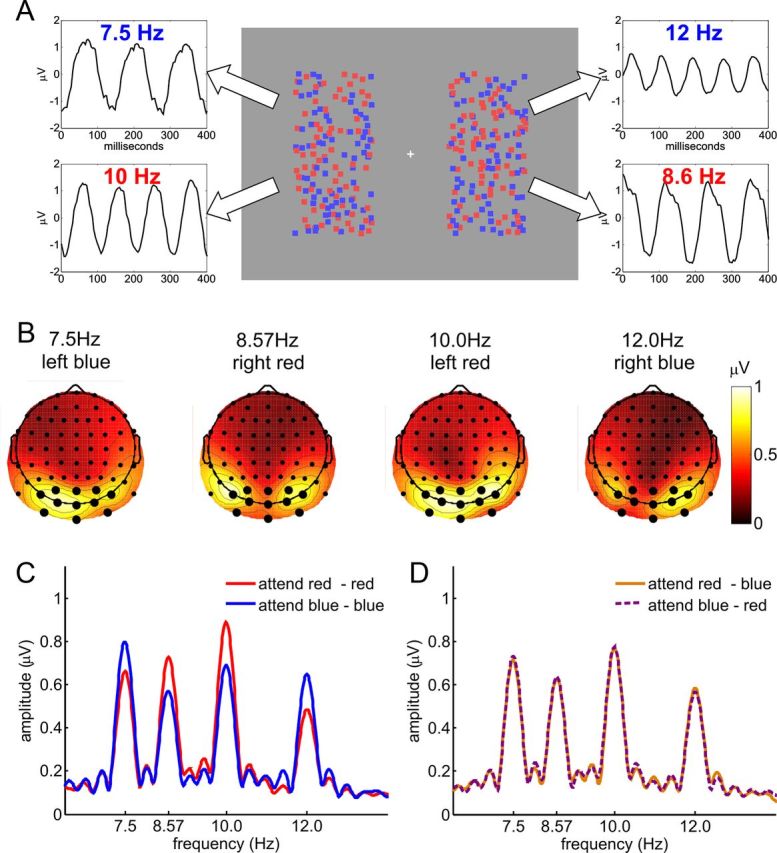
Figure 2.

Experiment 1. A, Stimulus display and schematic illustration of assignment of flicker frequencies to stimuli, together with SSVEP waveforms obtained from a single subject by moving window time-domain averages. All dots were in constant random incoherent motion, and each of the four fields of dots flickered at a specific frequency: blue left, 7.5 Hz; red left, 10 Hz; blue right, 12 Hz; red right, 8.6 Hz. B, Spline-interpolated isocontour voltage maps of SSVEP amplitudes averaged over all subjects and attentional conditions for each of the four frequencies. Electrodes used for the analysis are indicated by larger dots. C, D, Grand-average amplitude spectrum for attend-same (C) and attend-opposite conditions (D). SSVEP amplitudes at all four frequencies show clear enhancement with attention in attend-same conditions. This selectivity was absent in the attend-opposite conditions, where the attended color on one side was the same as the unattended color on the opposite side.
