
Figure 1.
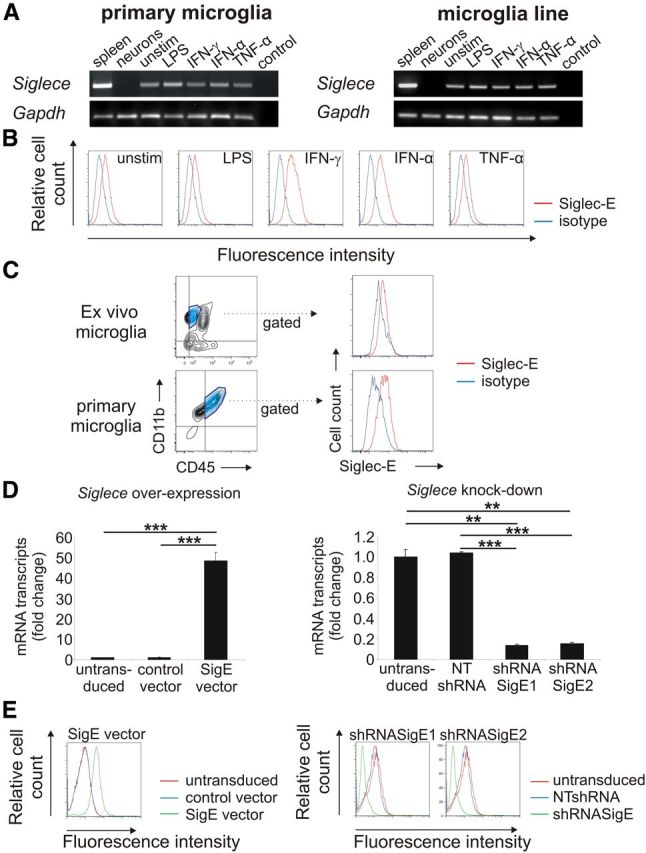
Detection of Siglec-E on microglia. A, Detection of Siglece mRNA in primary microglia and the microglia line. Spleen tissue served as positive control. Siglece transcripts were detected in unstimulated microglia (unstim.) as well as in microglia stimulated with LPS, IFN-γ, IFN-α, and TNF-α. No Siglece transcripts were detected in primary neurons. Gapdh mRNA served as housekeeping standard. Representative data of three independent experiments are shown. Control, Water control. B, Flow cytometry analysis of the microglial line. Siglec-E was detected on unstimulated (unstim.) microglia at low levels. Treatment with interferons (IFN-γ, IFN-α) slightly increased expression of Siglec-E, whereas treatment with LPS or TNF-α had no effect. Representative data of three independent experiments are shown. Isotype, Isotype control antibody. C, Flow cytometry analysis of ex vivo and primary microglia. Low constitutive expression of Siglec-E on CD11b+ and CD45low cells was detected. Representative data of three independent experiments are shown. Isotype, Isotype control antibody. D, Microglia were transduced with lentiviral vectors expressing Siglece (SigE vector) or a control vector. Furthermore, lentiviral knockdown was performed by two lentiviral short-hairpin constructs targeting Siglece (shRNASigE1; shRNASigE2) or a corresponding nontargeting control vector (NTshRNA). qRT-PCR confirmed the successful modification of the microglial line by showing an increased (left graph) or decreased (right graph) Siglece cDNA, respectively. **p ≤ 0.01, ***p ≤ 0.001. E, Flow cytometry analysis confirmed overexpression (left graph) and reduced expression (right graph) of the Siglec-E protein. Representative data of three independent experiments are shown.