
Figure 2.
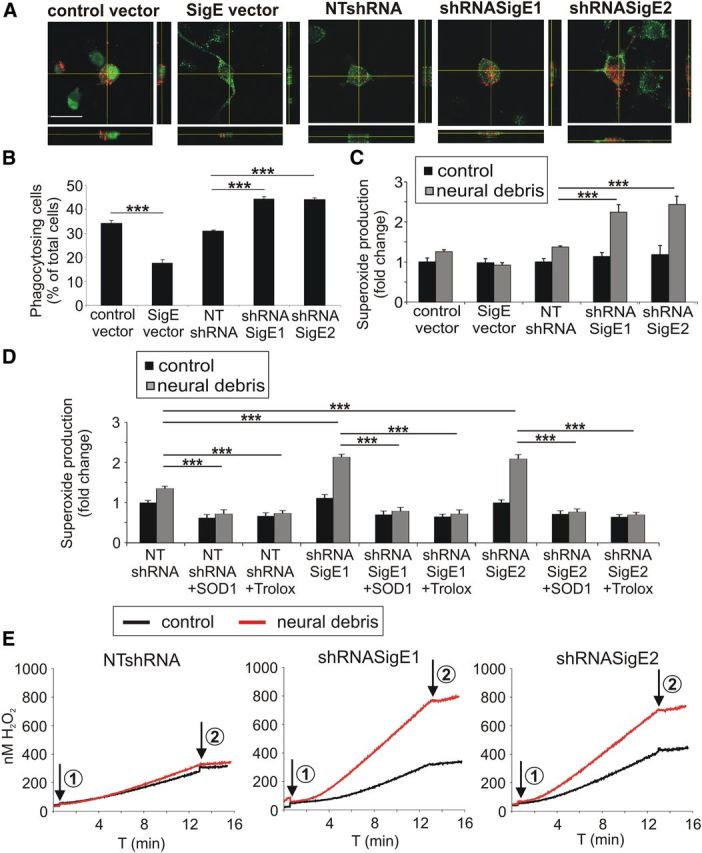
Siglec-E prevents phagocytosis and the associated reactive oxygen burst after challenge with neural debris. A, Uptake of red fluorescent-labeled neural debris into the microglial line was determined by confocal microscopy and 3D reconstruction. Microglial cells were transduced with the control vector, the Siglece overexpressing vector (SigE vector), the Siglece knockdown vectors (shRNASigE1, shRNASigE2) or the nontargeting vector (NTshRNA). Representative images of three independent experiments are shown. Scale bar, 20 μm. B, Phagocytosis of neural debris was quantified. Overexpression of Siglece mRNA reduced the uptake of neural material, whereas knockdown of Siglece increased the uptake of neural debris. ***p ≤ 0.001. C, Level of superoxide production as determined by DHE staining was quantified in the microglial line. After stimulation with neural debris, DHE intensity was increased after Siglece knockdown compared with the NTshRNA. ***p ≤ 0.001. D, Quantification of superoxide production as determined by DHE staining. After stimulation with neural debris in the presence of either 20 μg/ml SOD1 or 40 nm Trolox, increased DHE intensity after Siglece knockdown was antagonized. ***p ≤ 0.001. E, Quantification of superoxide production of microglial cells using the Amplex Red method. Knockdown of microglial Siglece via shRNASigE1 or shRNASigE2 increased the endogenous production of H2O2 equivalents after stimulation with neural debris compared with cells transduced with a control construct (NTshRNA). Arrow 1, Addition of cells; arrow 2, addition of 12,000 U/ml catalase. Representative data of three independent experiments are shown.