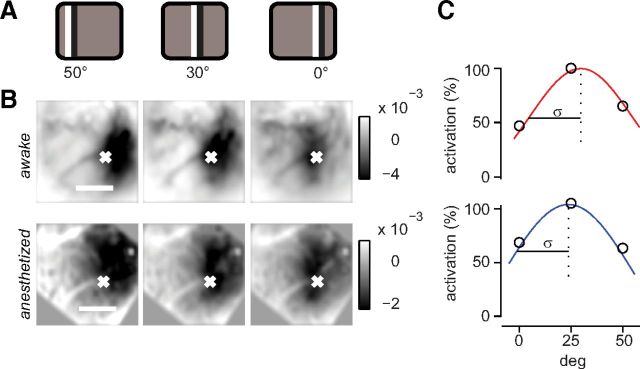
Figure 3.
Spatial properties of hemodynamic responses to flashing bars in mouse V1 in wakefulness and anesthesia. A, Flickering bar stimulus (15° wide) in three positions of the visual field. B, Responses to static flickering bars in the three different positions as in A for one example animal in awake (top) and anesthetized (bottom) conditions. Each image is a temporal average of the responses for 6 s after stimulus presentation. C, Amplitude of the responses for the three stimulus positions for the pixel marked with a white cross in B. A Gaussian curve is fitted to the points. The retinotopic preference is computed from the abscissa of the peak and the spatial spread from the σ of the fit, in wakefulness (top) and under anesthesia (bottom).

