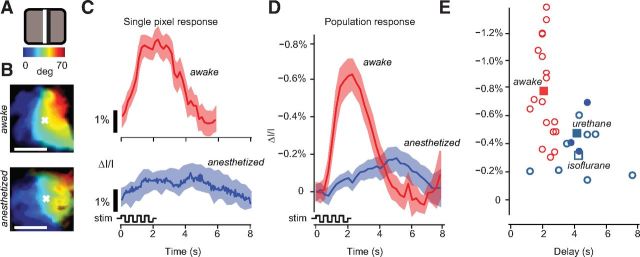
Figure 4.
Temporal properties of hemodynamic responses to flashing bars in mouse V1 in wakefulness and anesthesia. A, Flickering bar stimulus (15° wide, reversing in contrast at 2 Hz for 2 s) Color bars map degrees of visual field to the position of the bar on the screen. B, Maps of retinotopy for one example animal in awake (top) and anesthetized (bottom) conditions. Format is as in Figure 2B. C, Time courses of activity for the pixel marked with a white cross in B, in wakefulness (top, red trace), and under anesthesia (bottom, blue trace). Shaded regions, ± 1 SE. Bottom, Schematic of the luminance change of the stimulus flickering at 2 Hz. D, Same as in C, averages across all pixels in the ROI (see Materials and Methods) in all experiments, 18 in wakefulness (red trace) and 11 under anesthesia (blue trace). E, Amplitudes and delays for experiments in wakefulness (red circles) and under anesthesia (open blue circles, isoflurane; filled blue circles, urethane). Squares are means for each condition.

