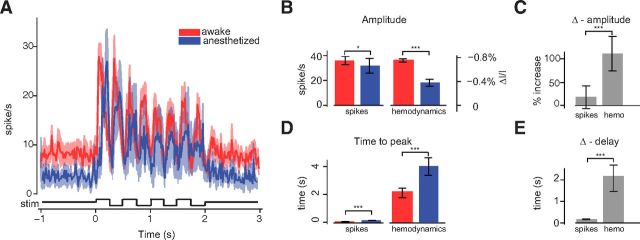
Figure 6.
Neural responses to flashing bars in wakefulness and anesthesia. A, Average time courses of the responses for all animals and experiments, 12 in wakefulness (red trace), and six under anesthesia (blue trace). Shaded regions, ± 1 SE. Bottom: Schematic of the luminance change of the stimulus, flickering at 2 Hz. B, Mean peak amplitude of neural responses (left) and hemodynamic responses (right), colors as in A. Error bars, ± 1 SE. C, Fractional amplitude change between awake and anesthetized conditions for spikes and hemodynamic responses. Error bars, ± 1 SE. D, E, same as in B, C for response delays computed as the time to reach the peak.

