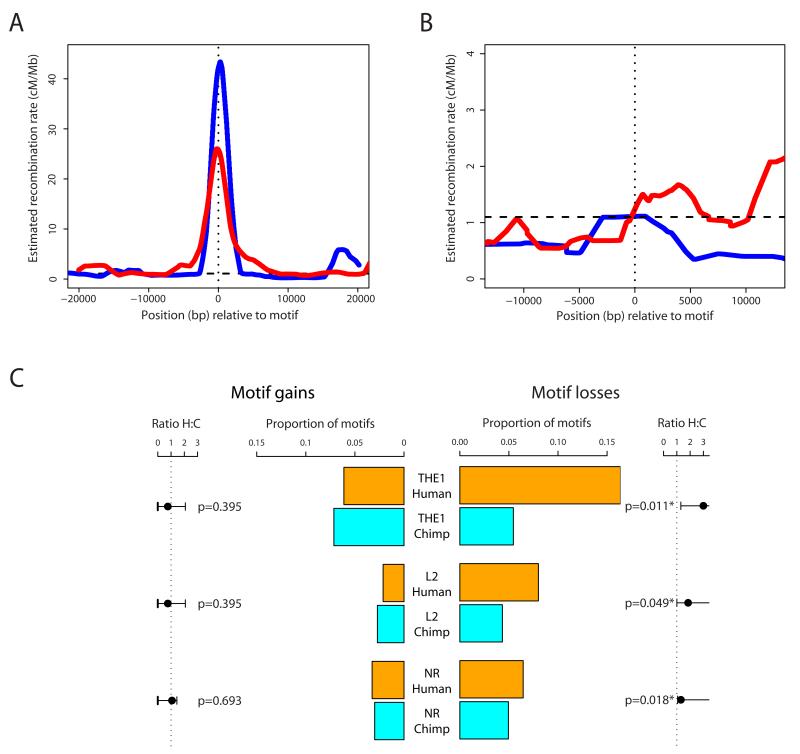
Figure 1.
Recombination rates and patterns of motif gain and loss in human and chimpanzee. For additional details, see (8). A Estimated HapMap Phase II recombination rate across the 40kb surrounding 16 human THE1 elements (red line) and 6 L2 elements (blue line) orthologous to the 22 regions analyzed in chimpanzee, and each containing a conserved exact match to the 13-bp core motif. Rates are smoothed using a 2kb sliding window slid in 50bp increments, averaged across elements. Horizontal dashed line: the human average recombination rate of 1.1cM/Mb. Vertical dotted line: the centre of the repeat. B Average estimated recombination rate for the western chimpanzee data across around the 16 THE1 elements (red line) and six L2 elements (blue line) containing the 13-bp core motif. Other details as for A. C Numbers of core motif gains (left hand bars) versus losses (right bars), inferred using macaque and orang-utan outgroup information (8), in humans (orange bars) and chimpanzees (cyan bars) on three backgrounds; THE1, L2 and non-repeat (NR). For each background, gains are shown as a fraction of motifs currently present in each species, losses as a fraction of motifs inferred in the human-chimpanzee ancestor. The intervals flanking the plot on each side show exact 1-sided 95% confidence intervals and associated p-values for testing equality of gain/loss rate between the species (8).

