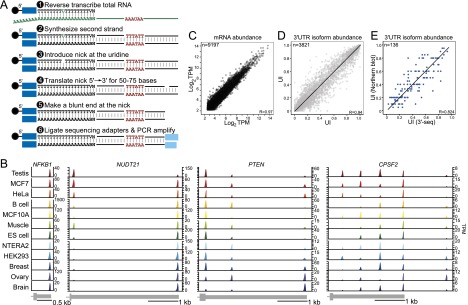
Figure 1.

3′-Seq generates a quantitative transcriptome-wide atlas of pA cleavage events. (A) 3′-Seq protocol. Total RNA was reverse-transcribed with an oligo(dT) primer extended at the 5′ end by a sequencing adapter bound to magnetic beads. The oligo(dT) primer contained a uridine. After second strand synthesis, a nick was introduced at the uridine, and nick translation was used to shift the nick ∼50–75 nt away from the 3′ end. At the new position of the nick, a blunt end was created, and the second sequencing adapter was ligated. After ∼10 cycles of PCR and gel purification, the library was sequenced. (B) Atlas of pA cleavage events. mRNA transcript abundance across human tissues and cell lines is shown; for example, genes with one, two, three, or five 3′ UTR isoforms. The peaks report the abundance of each isoform in transcripts per million (TPM). The gene model is drawn to scale and shows the terminal exon. (C) 3′-Seq is reproducible at the level of mRNA abundance. mRNA levels of biological replicate samples are shown in TPM. TPM is calculated using all reads that map to the 3′ UTR of a given gene. (D) 3′-Seq is reproducible at the level of 3′ UTR isoform abundance. The UTR index (UI) of replicate samples is shown. The UI reflects the fraction of reads mapping to a given pA site out of all of the reads mapping to the 3′ UTR. (E) Correlation of the UI as measured by 3′-seq and Northern blot analyses of 136 genes.
