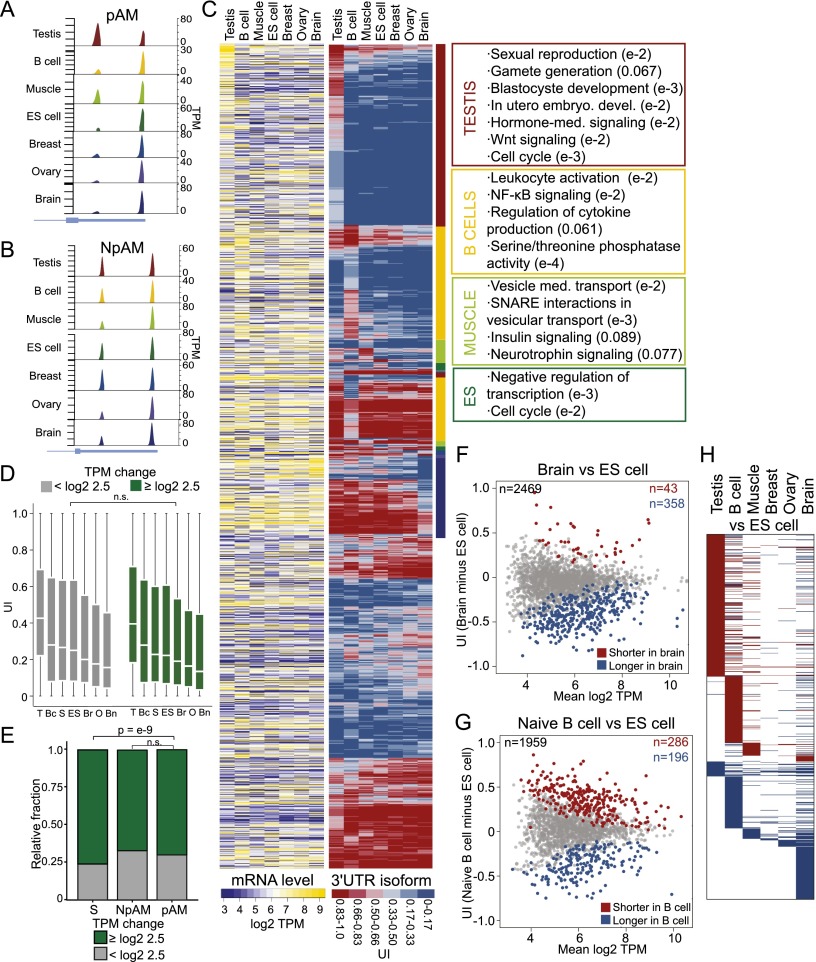
Figure 3.
ApA isoform levels in ubiquitously transcribed genes are tissue-specific and independent of mRNA levels. (A) An example of a pAM gene is shown (TRAPPC3). Details as in Figure 1B. (B) An example of an NpAM gene is shown (SUPT4H1). Details as in Figure 1B. (C, left panel) mRNA levels. Shown is the quantile-normalized mRNA abundance in TPM for all jointly expressed pAM genes (n = 1958). Each row corresponds to a gene, and each column corresponds to a tissue sample. mRNA levels are color-coded (see the legend), with yellow corresponding to high TPM levels and purple corresponding to low TPM levels. The ordering of the rows is described in the middle panel. (Middle panel) UI across tissues. Shown is the UI for all the genes from the left panel in the same order. The UI is color-coded (see the legend), with red corresponding to a high UI (high fraction of the short isoform) and blue corresponding to a low UI (high fraction of the long isoform). The color-coded bar to the right of the heat map indicates the tissue that shows an increased fraction of shorter or longer 3′ UTR isoforms. The color used for each tissue corresponds to the indicated tissues in the right panel. (Right panel) Significantly enriched GO terms for genes that generate a higher fraction of the shorter 3′ UTR isoforms in a specific tissue. All significant GO terms are listed in Supplemental Table 5. (D) The distribution of the UI in each tissue is independent of a change in mRNA levels across all seven tissues. A change in mRNA abundance was recorded if the range in mRNA levels across the seven tissue samples was log2TPM ≥ 2.5. Genes were split into two groups (those with a change in mRNA abundance [n = 1853–2196] and those without a change in mRNA abundance [n = 825–990]), and the distribution of the UI for each group was plotted. A Mann-Whitney test was performed comparing the two groups for each tissue separately, and in each case, the distributions were not significantly different (P > 0.1). The distribution is shown using box plots. (Horizontal line) Median; (box) 25th through 75th percentile; error bars indicate range. The tissue samples are indicated with letters. (T) testis; (Bc) B cells; (S) skeletal muscle; (ES) ES cells; (Br) breast; (O) ovary; (Bn) brain. (E) In genes with single 3′ UTRs, a significantly higher fraction of genes shows a change in mRNA levels [range of log2 TPM ≥ 2.5 across seven tissues] than in multi-UTR genes (Mann-Whitney test, P < 10−9). NpAM and pAM genes show a comparable fraction of genes that change their mRNA levels across the seven tissues (Mann-Whitney test, P < 0.08). (F) Difference in abundance of 3′ UTR isoforms between the brain and ES cells. The plot shows the difference in the UI of two samples (the UI in the brain minus UI in ES cells; Y-axis) as a function of mRNA abundance (mean log2 TPM of brain and ES cells; X-axis) for all jointly expressed genes. The statistically significant ApA events (FDR-adjusted P < 0.1) are color-coded. (G) Difference in the abundance of 3′ UTR isoforms between naïve B cells and ES cells. The plot is as described in F. (H) Heat map showing the significantly different ApA events (FDR-adjusted P < 0.1) between six differentiated tissues and ES cells. Shown are all jointly expressed genes. Each row corresponds to a gene. (Red) Higher fraction of the shorter 3′ UTR isoform observed in the differentiated tissue; (blue) higher fraction of the longer 3′ UTR isoform observed in the differentiated tissue; (white) no significant difference in 3′ UTR isoform levels between ES cells and a given differentiated tissue.

