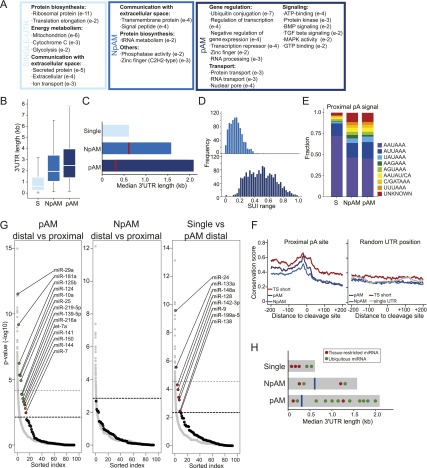
Figure 5.
pAM genes are regulated at the post-transcriptional level by miRNAs as well as through differential ApA site usage. (A) Enriched GO terms in ubiquitously transcribed single-UTR, NpAM, and pAM genes. All significant GO terms are listed in Supplemental Tables 6–8. (B) 3′ UTR length in ubiquitously transcribed single-UTR, NpAM, and pAM genes. Box plots were plotted as in Figure 3D. (C) Median 3′ UTR length in single-UTR, NpAM, and pAM genes. The horizontal bars show the median distance from the stop codon to the distal pA sites. The red line depicts the median distance from the stop codon to the proximal pA sites. (D) Range of the SUI at a given pA site across the seven tissue samples in NpAM and pAM genes. (E) Relative frequency of the pA hexamer sequence in ubiquitously transcribed single-UTR, NpAM, and pAM genes at the proximal (or only) pA sites. (F) Conservation score in the 400 nt surrounding the proximal pA site in ubiquitously transcribed NpAM and pAM genes. pAM genes with an increased fraction of the shorter 3′ UTR isoform in a single tissue (TS short; Fig. 3C, top half) are shown separately (red). As a control, the conservation score at a random position within the 3′ UTR is shown. Conservation was calculated using phastCons tracks from 46 vertebrates (see the Supplemental Material). (G, left panel) Enrichment of conserved miRNA-binding sites for ubiquitously transcribed genes in the distal compared with the proximal part of the 3′ UTR of pAM genes. Each black dot shows the negative log P-value for the enrichment statistic for a miRNA (binomial test) (see the Supplemental Material). All broadly conserved miRNA seed families as well as miRNAs that are expressed in the seven tissues are included in the analysis (92 miRNAs total) (Supplemental Table 9). As a control, the same enrichment statistics are shown for conserved seed matches for 10,000 randomly generated miRNA seeds with the same nucleotide composition as the true miRNAs (gray dots). miRNAs are ordered along the X-axis by decreasing significance of enrichment. The dotted lines show the cutoff using an FDR = 0.1 or FDR = 0.25 (bold) relative to the empirical null model (see the Supplemental Material). (Middle panel) As in the left panel but enrichment of conserved miRNA-binding sites for ubiquitously transcribed NpAM genes comparing the distal and the proximal part of the 3′ UTR. In this comparison, none of the miRNAs was significantly enriched at an FDR-corrected empirical P-value threshold of P < 0.25. Therefore, we placed a single horizontal line above the top-ranked miRNA to indicate that all of the miRNAs fall below the 0.25 FDR threshold. (Right panel) As in left panel but enrichment of conserved miRNA-binding sites for ubiquitously transcribed genes with single 3′ UTRs compared with the distal part of the 3′ UTR of pAM genes. (H) Model for different modes of the tissue-specific miRNA/target interaction in single-UTR and multi-UTR genes (see the text). Features are as in C.

