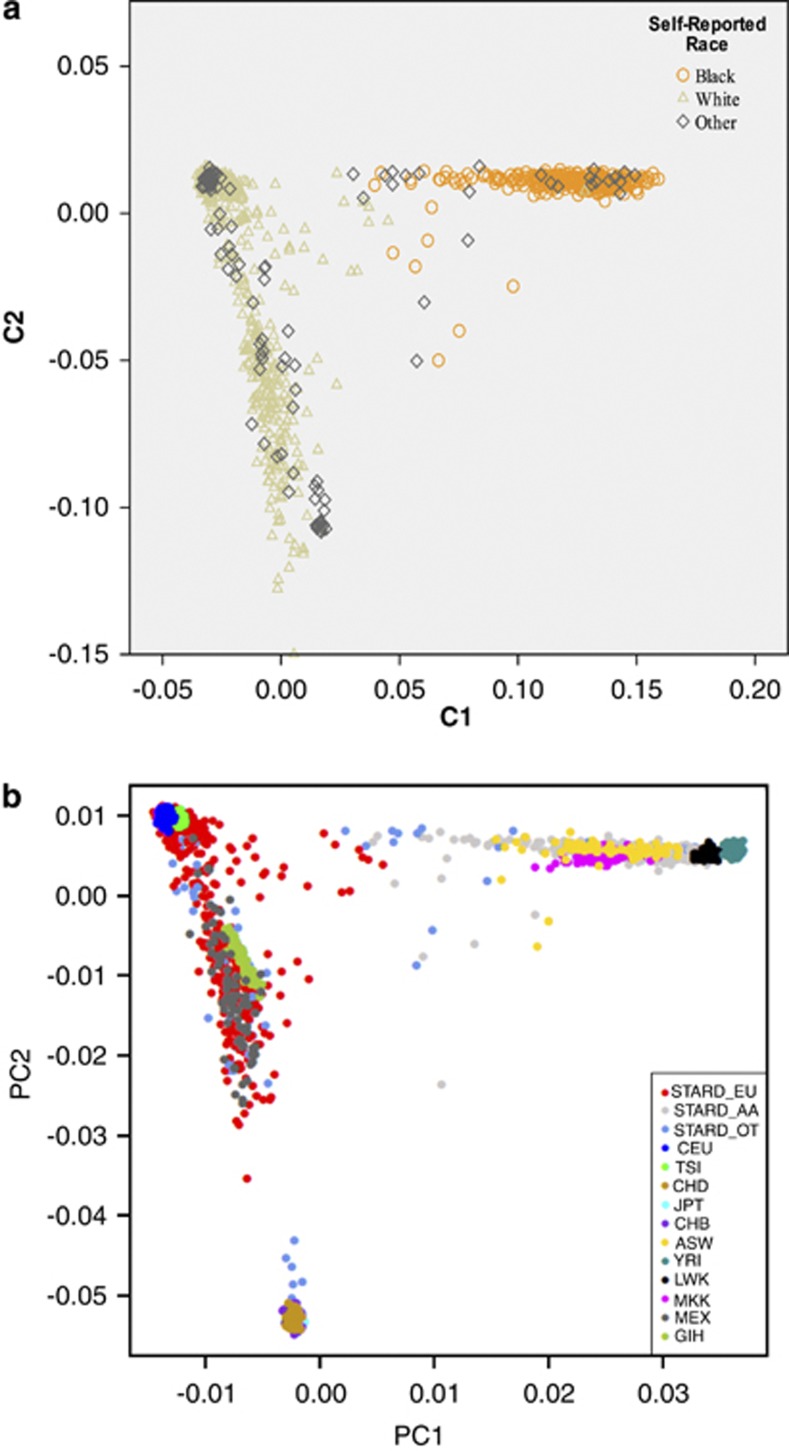
Figure 1.
(a) Genetic ancestry cluster dimensions among the self-reported racial groups. X-axis shows scores along C1 dimension depicting African ancestry, whereas Y-axis shows scores along C2 dimension depicting European ancestry. The other clusters (C3 and C4) obtained from MDS analyses failed to differentiate along genetic ancestry dimensions and therefore are not depicted in the figure. (b) STAR*D genetic ancestry clusters with HapMap phase III reference panels. ASW, African ancestry in Southwest USA; CEU, Utah residents with northern and western European ancestry (CEPH); CHD, Chinese in metropolitan Denver, Colorado; GIH, Gujarati Indians in Houston, Texas; JPT, Japanese in Tokyo; LWK, Luhya in Webuye, Kenya; MEX, Mexican ancestry in Los Angeles, California; MKK, Masai in Kinyawa, Kenya; STARD_EU/STARD_AA/STARD_OT, self-reported White/Black or African American/other race in STARD*D sample; TSI, Tuscans in Italy: CHB, Han Chinese in Beijing: and YRI, Yoruba in Ibadan, Nigeria.

