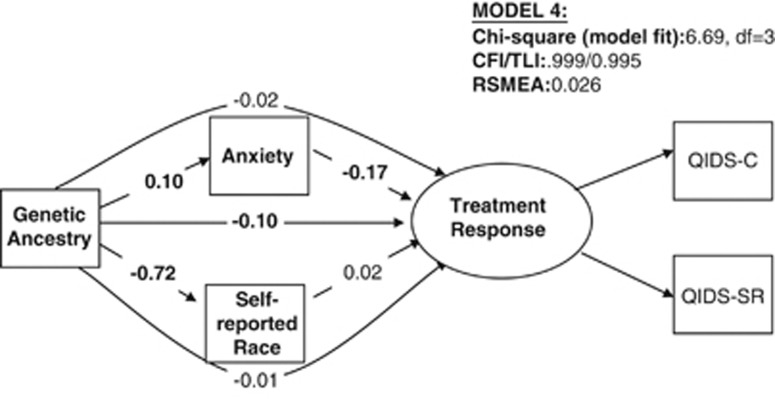
Figure 3.
Effects of genetic ancestry, self-reported race, and anxiety on treatment response. The diagram refers to model 4 as described in the text. Direct effects are represented by straight arrows and indirect (mediator) effects are represented by curved arrows. For all models, coefficients (rounded to the nearest hundredth) represent standardized units, ie, the effect of one SD change in predictors on SD change in treatment response, and are comparable within models across predictors. All coefficients in bold are significant at p<0.05 level (two-tailed). Genetic ancestry: total effects=−0.129***, direct effects=−0.100**, and indirect effects=−0.029); self-reported race: total effects=0.017, direct effects=0.017, and indirect effects=N/A; anxiety: total effects=−0.174***, direct effects=−0.174, and indirect effects=N/A. When HRSD17 is included as part of treatment response, the impact of genetic ancestry on TR is −0.108 (p<0.01); the impact of self-reported race is 0.014 (p>0.500); and the impact of anxiety on TR is −0.156 (p<0.001).

