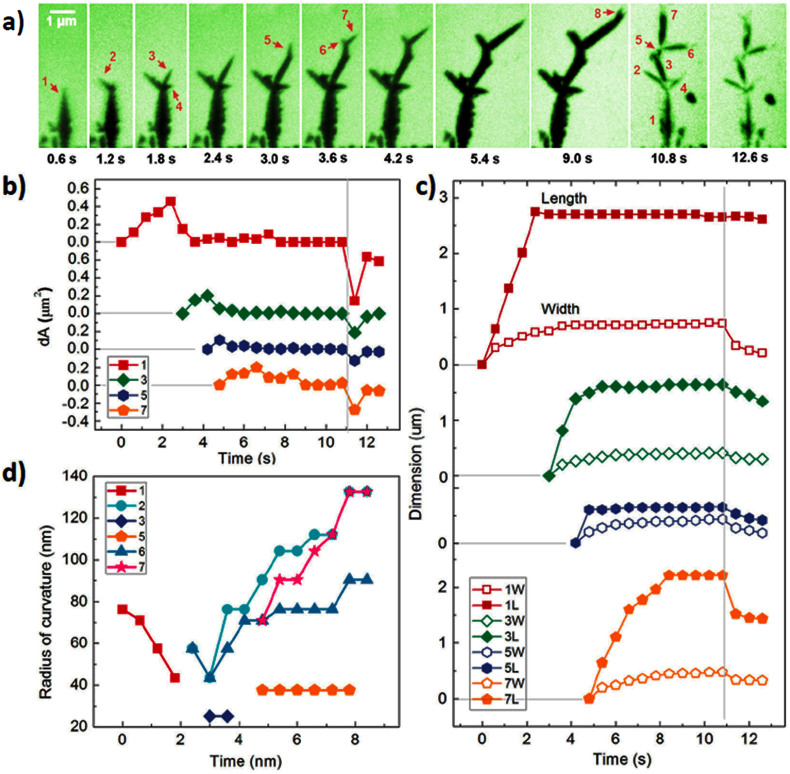
Figure 2. Trajectories of lead dendrites during growth and dissolution.
(a) Time series of TEM images showing growth and dissolution of Pb dendrites; (b) Area changes of five selected branches versus time; (c) Length and width changes of each individual branch as a function of time; (d) Sharpness changes of the tip as a function of time.

