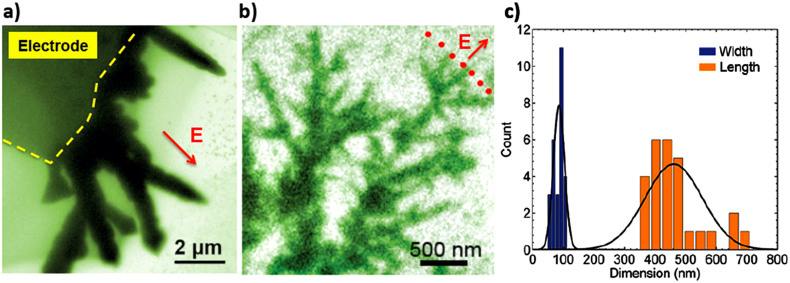
Figure 4. Effects of lead ion concentration in the precursor solution on the dendrite morphology.
(a) A snapshot image of lead electro-deposited on the electrode from the solution with lead concentration of 100 mg/mL; (b) A snapshot image of lead electro-deposited on the electrode from the solution with lead concentration of 5 mg/mL; (c) Statistic width and length of the branches in b.

