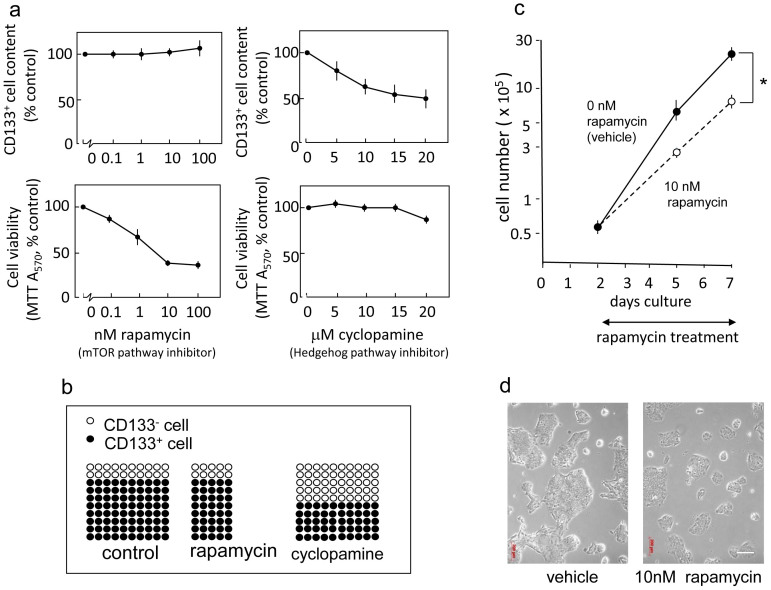
Figure 1. The mTOR inhibitor rapamycin does not affect the frequency of CD133+ cells but significantly reduces the viability of pancreatic cancer cells.
(a) Capan-1M9 cells were treated with the inhibitors at the indicated concentrations for three days. The effects of the mTOR inhibitor rapamycin and the Hedgehog pathway inhibitor cyclopamine on CD133+ cell frequency and cell viability were determined by flow cytometry and the MTT assay, respectively. The results are presented as percentages of control values in untreated cells, showing the mean and s.d. of four replicates obtained in one representative experiment out of three. (b) Schematic representation of the effects of rapamycin and cyclopamine on cell viability of CD133+ and CD133− cells. The vertical axis indicates the CD133+ cell frequency, and the horizontal axis indicates the total cell viability. The closed circles represent the CD133+ cells, and the open circles represent the CD133− cells. (c) The mTOR inhibitor rapamycin suppresses the growth of Capan-1M9 pancreatic cancer cells. The cells were seeded at an initial density of 105 cells per 35-mm dish. Rapamycin was administered two days after plating, and the cell numbers were then determined over a period of five days using trypsin/EDTA treatment. The vertical axis is shown on a logarithmic scale. All data are the mean ± s.d. *P < 0.01. (d) Morphology of Capan-1M9 cells untreated (left) and treated (right) with 10 nM rapamycin for three days. Scale bar, 200 μm.

