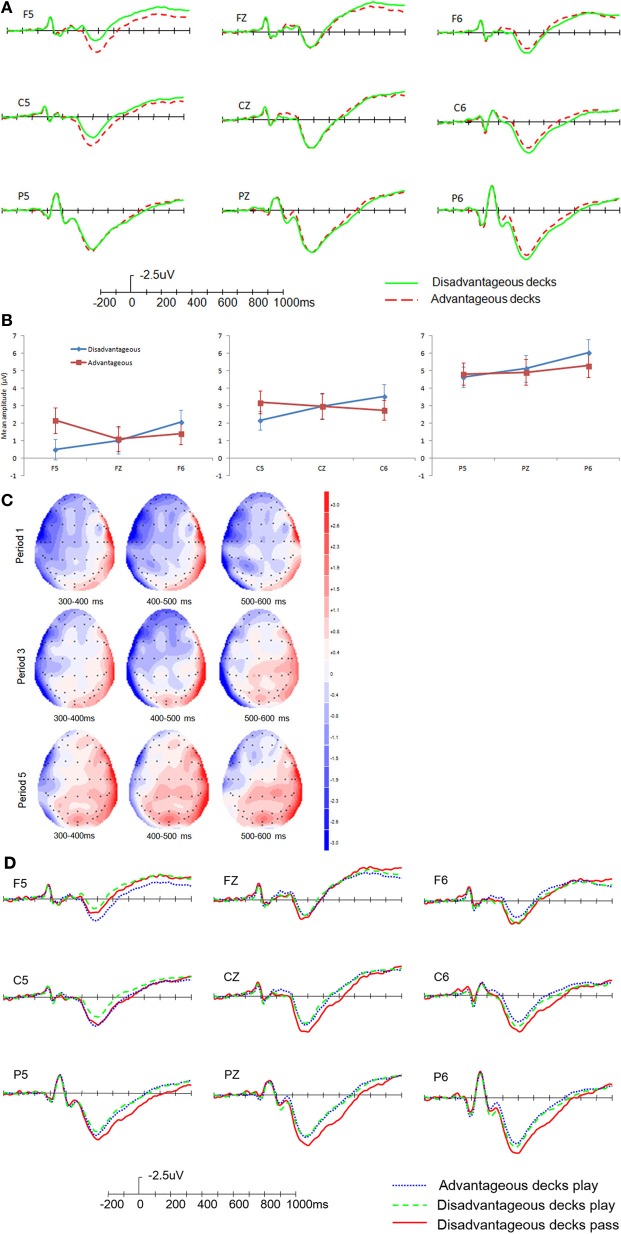
Figure 3.
ERP results in the choice evaluation stage. (A) Global difference between advantageous and disadvantageous decks. (B) Amplitudes of disadvantageous decks and advantageous decks in different regions. (C) Topographical maps for the difference wave between disadvantageous decks and advantageous decks in different periods of the task. (D) Comparison of modulations between different responses. Error bars indicate the standard error.

