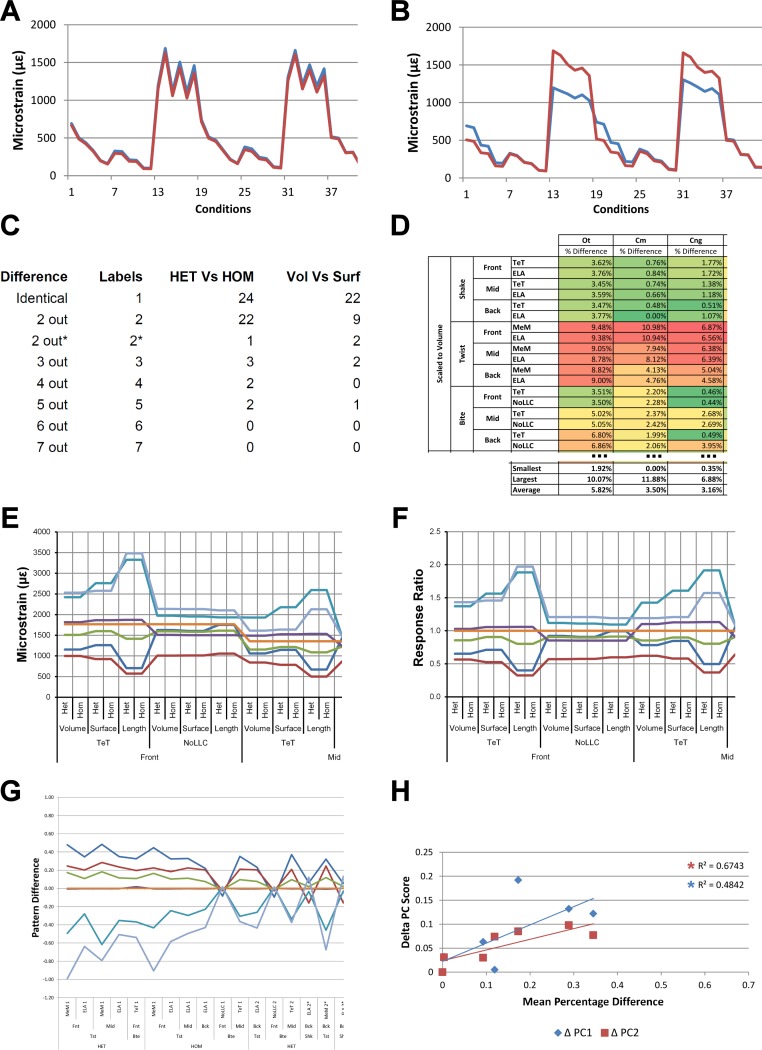
Figure 1. Data collection and visualisation.
Data presented here is used only to illustrate and summarise how results are presented, interpreted, and analysed. Response is plotted as a signal for different sets (a ‘set’ is an arbitrarily ordered group of conditions with a common parameter) showing good (A) and poor (B) correlation between input conditions for an individual species model. (A) corresponds to a HET vs HOM comparison for O. tetraspis (see Fig. 2A), while (B) corresponds to a Linear Load Case comparison for O. tetraspis (see Fig. 8A). (C) Predictive rank of species models between comparison sets. Labels are used as shorthand to indicate how well rank predictions correlate between input conditions, low numbers indicate good correlation, while high indicates poor correlations. See Table 3 for specific details, and Figs. 5, Figs. S2, S6–S8, S10, S14–S16 for label implementation. (D) Absolute percentage difference between the response of each species model (indicated above columns) for comparison sets; green to red shading indicates low to high values. Here (D) corresponds to a HET vs HOM comparison snipped from Fig. S1; note that the conditions from top to bottom in (D) also correspond to those ordered left to right in signal (A). This is consistent for all compared modelling factors; e.g. for scaling comparisons the order is consistent between signal (Fig. 7) and percentage differences (Figs. S3–S5). (E) Charts of pattern, plotting strain response of individual species models (coded by colour) to individual conditions. (F) Charts of standard pattern plot the ratio (‘Response ratio’) of strain response in each species (εsp) model (coded by colour) to strain in M. cataphractus (εMc) for individual conditions, i.e., εsp/εMc. (G) Charts of standard pattern difference, where the difference in standard pattern is taken between pairs of sets under comparison. (H) Interspecies shape difference (ΔPC1 and ΔPC2) plotted against mean percentage difference to determine if differences between comparison sets correlate with shape differences.

