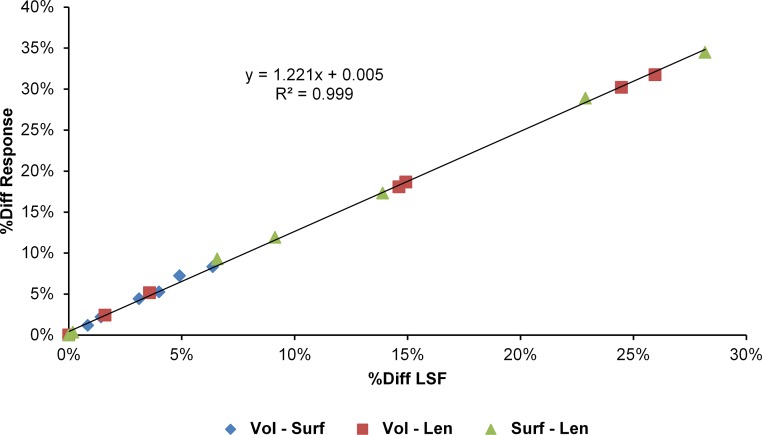
Figure 10. Difference in linear scaling factor vs difference in response for scaling parameters.
The percentage difference between the Linear Scaling Factors (%Diff LSF) used to scale each species model to the same volume, surface, or length as M. cataphractus is plotted against the average percentage difference between the responses of each species model (%Diff Response) at each re-scaled size. Note the strong linear relationship between the differences in LSF and differences in response.

