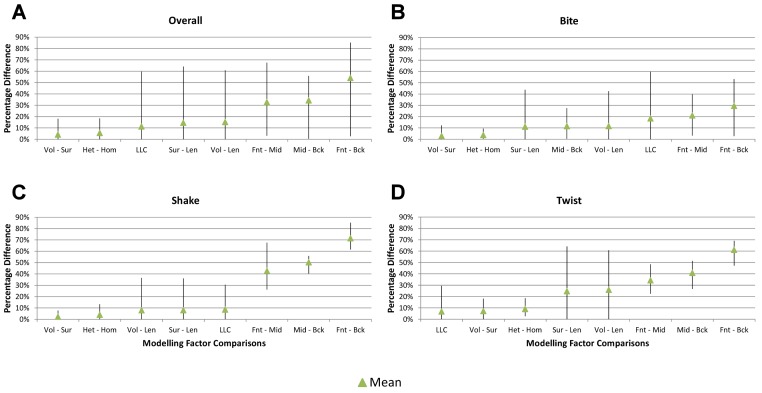
Figure 11. Min, Max, and Mean percentage differences.
The range of percentage differences for each modelling factor comparison is indicated by the upper (maximum % difference) and lower (minimum % difference) extent of vertical bars, ordered left to right based on their aggregated average. Overall (A) includes differences from all feeding behaviours, while bite (B), shake (C), and twist (D) only include differences from their respective feeding types. Note that the order of modelling factor comparisons changes between biting (B), shaking (C), and twisting (D), suggesting that different feeding types are more (or less) sensitive to different modelling factors.

