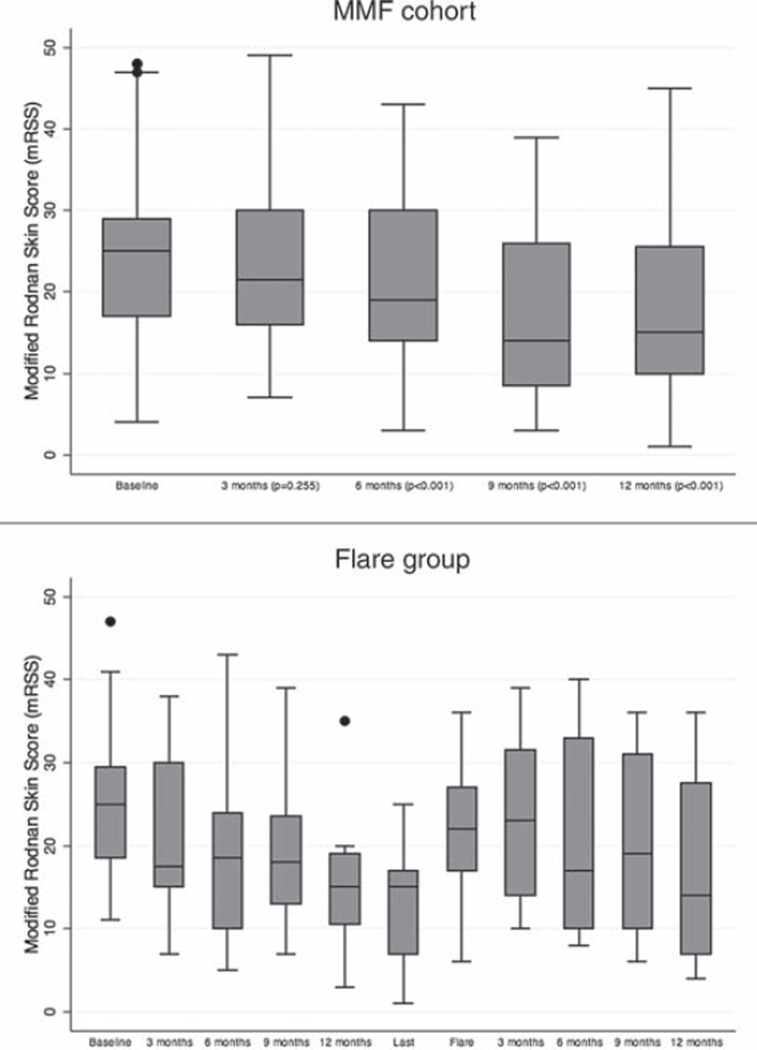
Figure 1.
(A) Course of the modified Rodnan skin thickness score (mRSS) for the mycophenolate mofetil (MMF) cohort. (B) Course of the mRSS for the ‘flare’ group. Data are shown as box plots. Each box represents the IQR, indicating the first (25th percentile) and third (75th percentile) quartiles. Lines inside the boxes represent the median. Whiskers represent 1.5 times the first and third quartile. Circles indicate outliers.

