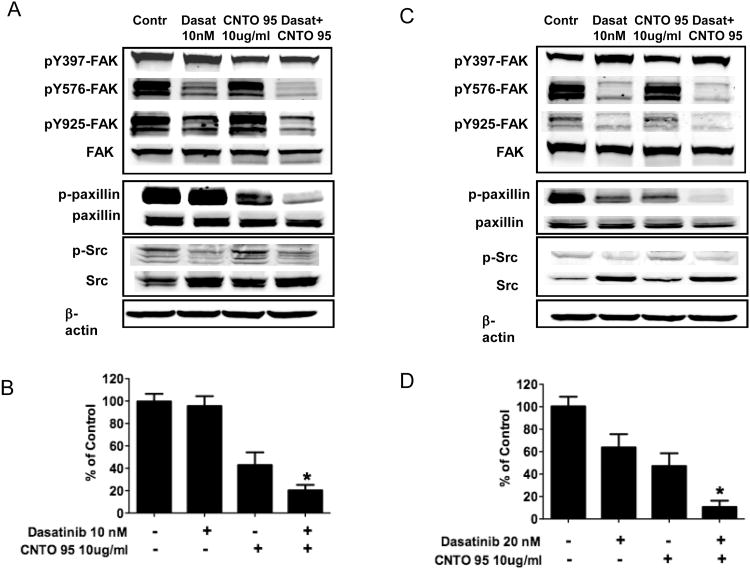
Figure 5. The effect of CNTO95 and dasatinib on integrin signal transduction in HCT-116 cells (A, B) and RKO cells (C, D).
Western blots of whole cell lysates from drug treated and untreated control HCT-116 cells (A) or RKO cells (C). Quantifications of paxillin phosphorylation in HCT-116 cells (B) and RKO cells (D) are displayed as bar graphs. *, significantly different from either drug treatment, P<0.05. Data are shown as the mean ± SD.

