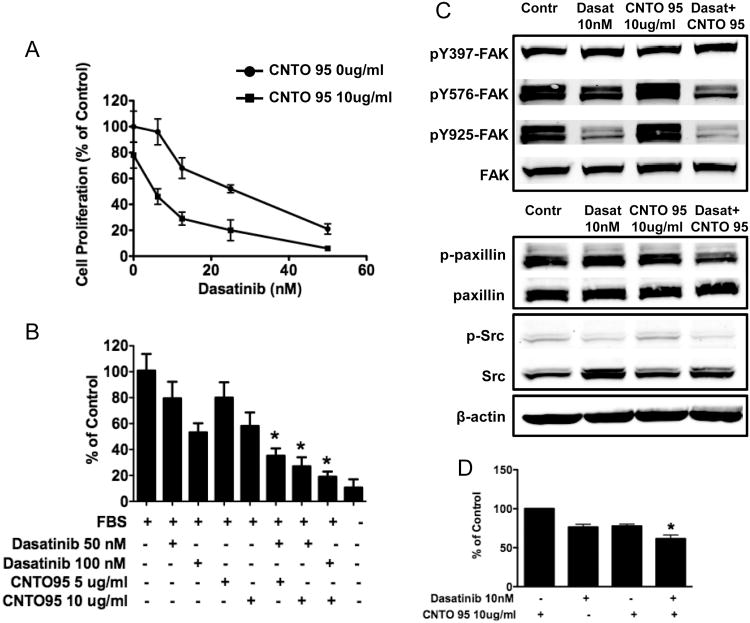
Figure 6. The effect of CNTO95 and dasatinib on HUVEC cell viability (A), invasion (B) and signal transduction (C, D).
(A) Inhibition of cell viability was presented as the percent value of the untreated cells. (B) Drug treatment induced inhibition on HUVEC cell invasion was quantified and displayed as the bar graph. (C) Western blots of whole cell lysates from drug treated and untreated HUVEC cells. (D) Drug treatment induced inhibition on paxillin phosphorylation was quantified and presented as the bar graph. *, significantly different from either drug treatment, P<0.05. Data are shown as the mean ± SD.

