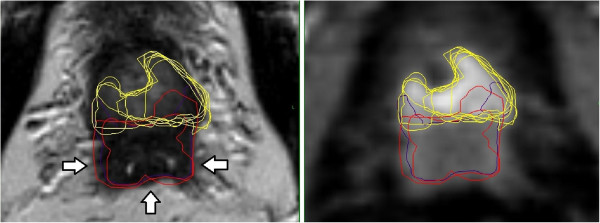
Figure 6.

(Patient No. 2). Transversal slices through prostate base and adjacent seminal vesicles; left = T2w-, right = DCE-sequence. Left: the diffuse low signal intensity forced two observers to include the junction of seminal vesicles in the prostate base (violet and red contours, arrows) into the GTV at T2w images. Right: DCE based GTV-definition (yellow contours).
