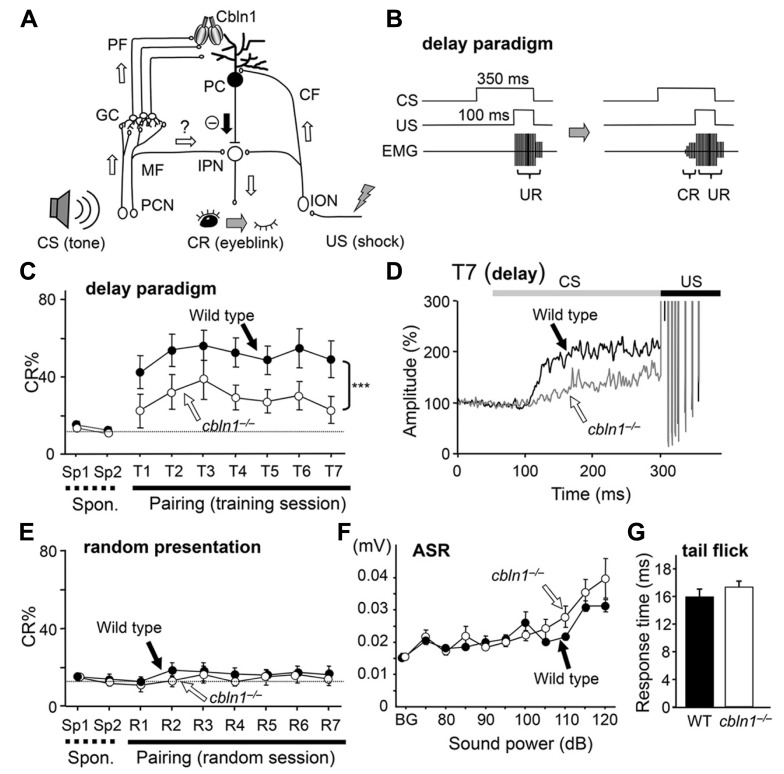
FIGURE 1.
Delay eyeblink conditioning (EBC) is impaired in cbln1-/- mice. (A) A diagram showing the cerebellar circuits responsible for delay EBC. A conditioned stimulus (CS) tone increases the activities of precerebellar nuclei (PCN), which send MF to granule cells (GCs). Some MFs may also innervate the interpositus nucleus (IPN). Parallel fibers (PFs), which are GC axons, secrete Cbln1, which regulates the integrity and plasticity of PF–Purkinje cell (PC) synapses. An unconditioned stimulus (US) is mediated by the activities of the inferior olivary nuclei (ION), which send climbing fibers (CFs) to the IPN and PCs. (B) A diagram showing the delay EBC paradigm. A CS tone (350 ms) precedes and co-terminates with a US (100 ms). Mice were trained for one session per day for 7 days. Associative learning was established when conditioned response (CR), detected by electromyogram (EMG), was observed before the unconditioned eyeblink response (UR). (C) Impaired delay EBC in cbln1-/- mice. The CR% was significantly smaller for cbln1-/- than wild-type mice (p < 0.01, two-way repeated measures ANOVA, n = 8 mice for each group). T1–T7, training sessions; Sp1 and Sp2, spontaneous eyeblink responses before training. The Y-axis gives the percentage of trials showing positive CR. (D) Averaged EMG amplitude on the last day of training (T7). The EMG amplitudes were normalized to those during the initial 30 ms of CS. n = 8 for each group. (E) CRs by pseudo-random test. CS and US stimuli were randomly presented to wild-type and cbln1-/- mice. There was no significant difference in CR% between two groups (p > 0.1). (F) Acoustic startle response (ASR) test. There was no significant difference in the amplitude between wild-type and cbln1-/- mice (p > 0.5, by two-way repeated measures ANOVA, n = 8 for each group). (G) A tail-flick test. No significant difference was found in response time to nociceptive stimuli between wild-type and cbln1-/- mice (p > 0.5, by Mann–Whitney’s U test, n = 8 for each group). The dotted lines in C and E correspond to the percentage of CR-like activities on Sp2 to indicate the baseline for learned responses.

