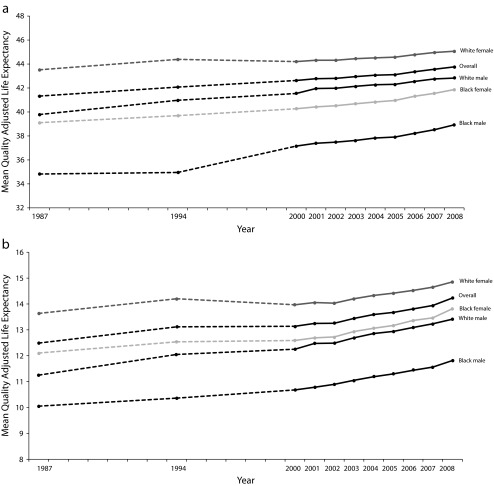
FIGURE 1—
Trends in quality-adjusted life expectancy at (a) age 25 years and (b) age 65 years: United States, 1987–2008.
Note. Dashed lines indicate that data was not available for intervening years. The 95% confidence intervals for overall change are smaller than the width of the line. All trends exclude those of “other” race (not White or Black).
Source. National mortality data combined with data on symptoms and impairments from the National Medical Expenditure Survey (1987), National Health Interview Survey (1987, 1994–1995, 1996), Medical Expenditure Panel Survey (1992, 1996, 2000–2008), National Nursing Home Survey (1985, 1995, and 1999), and Medicare Current Beneficiary Survey (1992, 1994–2008).

