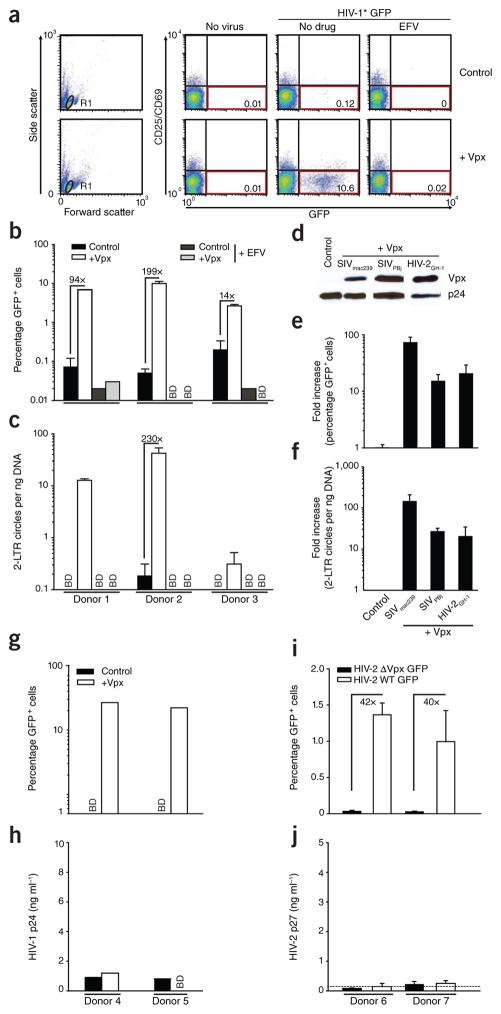
Figure 1.
Vpx overcomes a restriction to HIV-1 and HIV-2 infection in resting human CD4+ T cells. (a–c) Resting CD4+ T cells were challenged with equivalent infectious units of HIV-1* GFP virions with (+Vpx) or without (Control) incorporated Vpx from SIVmac239 and analyzed on day 3 after infection. The reverse transcriptase inhibitor efavirenz (EFV) served as specificity control. (a) Dot plots of flow cytometric analysis for 1 out of 23 donors. The percentages of viable (gate R1, left graphs) resting (CD25−CD69−) and infected (GFP+) CD4+ T cells are shown in the bottom right quadrants. (b,c) Percentage of GFP+ cells (b) and relative copy numbers of HIV-1 2-LTR circles (c). Bars represent means of triplicates + s.d., with the factors of increase by Vpx indicated. (d) Immunoblotting of HIV-1 virions for incorporated epitope-tagged Vpx proteins from SIVmac239, SIVPBj or HIV-2GH-1. HIV-1 p24 served as a loading control. (e,f) Percentage of GFP+ cells (e) and relative 2-LTR circle copy numbers (f) of resting CD4+ T cells challenged with the Vpx-carrying viruses relative to the Vpx-negative control virus. Bars represent means + s.e.m. of the factors of increase (n = 4). Percentages of GFP+ cells ranged from 0.5% to 3.1% for Vpx of SIVmac239, from 0.2% to 0.7% for Vpx of SIVPBj and from 0.1% to 0.9% for Vpx of HIV-2GH-1. (g–j) Resting CD4+ T cells from the same donors were challenged with equivalent infectious units of HIV-1* GFP virions with (+Vpx) or without (Control) incorporated Vpx (g,h) or HIV-2ROD9 GFP or HIV-2ROD9 ΔVpx GFP (i,j) and analyzed for the percentage of GFP+ cells (g,i) and the amount of HIV-1 p24 or HIV-2 p27, respectively, released into the cell culture supernatant on day 3 after infection (h,j). Bars in i,j represent means of triplicates + s.d. The dotted line in j indicates the cut-off of the p27 ELISA. BD, below detection.

