
Figure 3.
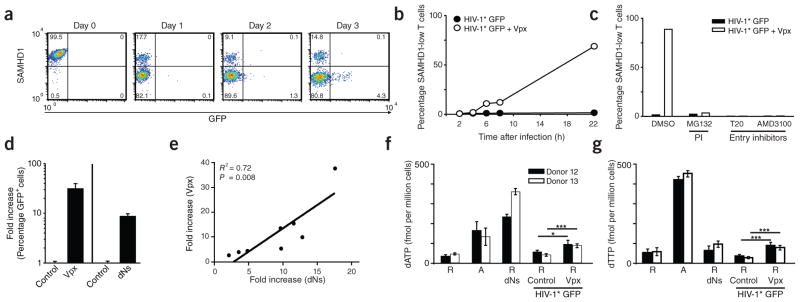
Susceptibility of resting CD4+ T cells to Vpx-carrying HIV-1 is paralleled by proteasomal degradation of SAMHD1 and increased dNTP levels. (a) Time course of SAMHD1 and GFP expression in resting CD4+ T cells after challenge with HIV-1* GFP + Vpx (SIVmac239). The percentages of cells in the respective quadrants are shown. (b) Quantification of SAMHD1 expression in resting CD4+ T cells within the first 22 h after exposure to HIV-1* GFP with (+ Vpx) or without (Control) incorporated Vpx. Data points mark the percentages for cells with low SAMHD1 levels (corresponding to the bottom left quadrants in FACS panels shown in a). (c) Effect of proteasome or HIV-1 entry inhibitors on SAMHD1 levels in resting CD4+ T cells after exposure to HIV-1* GFP ± Vpx. Resting CD4+ T cells were pretreated for 1 h with either the proteasome inhibitor (PI) MG132 (10 μM), the fusion inhibitor T20 (50 μM) or the CXCR4 antagonist AMD3100 (5 μM) before infection with HIV-1* GFP with or without virion-packaged Vpx. Drugs were removed 20 h later. Shown are the percentages of resting CD4+ T cells with low levels of SAMHD1 24 h after infection for one of three donors. (d) Relative factor of increase of infection of resting CD4+ T cells with HIV-1* GFP by virion-packaged Vpx (n = 15) or by incubation with deoxynucleosides (dNs) (n = 8). Means + s.e.m. (e) Correlation between the enhancement of infection of resting CD4+ T cells with HIV-1* GFP either by virion-packaged Vpx or by dN treatment. Depicted is the relative factor of increase in infection for both parameters obtained in parallel experiments for cells from eight different donors. (f,g) Quantification of dATP (f) and dTTP (g) levels in primary CD4+ T cells under different experimental conditions determined by single-nucleotide incorporation assay. R, resting CD4+ T cells; A, activated CD4+ T cells. dNs, cultivation in the presence of dNs (2 mM) for 3 h. Challenge with HIV-1* GFP + Vpx had resulted in depletion of SAMHD1 in 17% (donor 12) or 31% (donor 13) of resting CD4+ T cells 24 h after challenge, respectively, at which time cells were harvested for subsequent dNTP analyses. See also Supplementary Figure 10 for primary data of the single-nucleotide incorporation assay. *P < 0.05; ***P < 0.005.