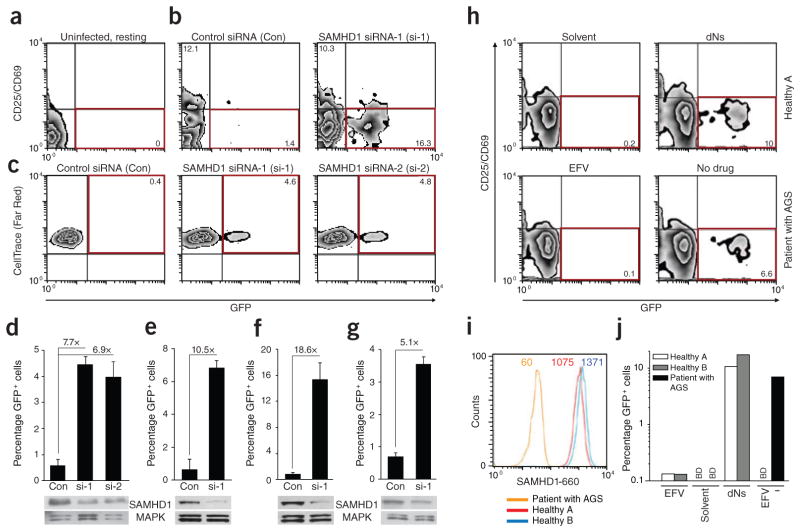
Figure 4.
Silencing of SAMHD1 by RNA interference or a homozygous nonsense mutation renders resting CD4+ T cells permissive for HIV-1 infection. (a–c) Flow cytometric analysis of freshly isolated, uninfected resting CD4+ T cells (staining reference) (a) or of post-activated resting CD4+ T cells infected with HIV-1 GFP after treatment with the indicated siRNAs (b,c). Red boxes indicate populations of infected cells with relative percentages indicated. Cells’ activation state was assessed by surface expression of CD25 and CD69 (a,b) or CellTrace (Far Red) dilution (c). (d–g) Quantification of the percentage of GFP+ cells and the relative increase of HIV-1 GFP infection in resting CD4+ T cells from four donors (each corresponding to a panel) following silencing with SAMHD1-specific siRNAs (si-1 or si-2) relative to a nontargeting control siRNA (Con). Shown are means + s.d. of triplicate infections. SAMHD1 levels in corresponding cell lysates were determined by immunoblotting. MAPK, loading control. See also Supplementary Figure 11b–e for results with cells from two additional donors, including the use of SAMHD1 si-3. (h) Flow cytometric analyses of PBMCs from healthy donor A (solvent- or dN-treated, top graphs) or PBMCs from a patient with AGS with a homozygous nonsense mutation in the SAMHD1 gene (EFV-treated or untreated, bottom graphs) 3 d after challenge with HIV-1 GFP (multiplicity of infection = 1). The percentages of resting (CD25−CD69−), infected (GFP+) CD3+CD4+ PBMCs are shown in the bottom right quadrants boxed in red, with the percentage of infected cells indicated. (i) Intracellular SAMHD1 expression in resting CD4+ T cells of PBMCs from the patient with AGS and from healthy donors A and B, as determined by flow cytometry. The mean fluorescence intensity of SAMHD1 levels is indicated. (j) Quantification of the percentage of infected (GFP+) resting CD4+ T cells from the patient with AGS and from healthy donors (see panel h for primary data). Shown are arithmetic means of duplicates. BD, below detection.

