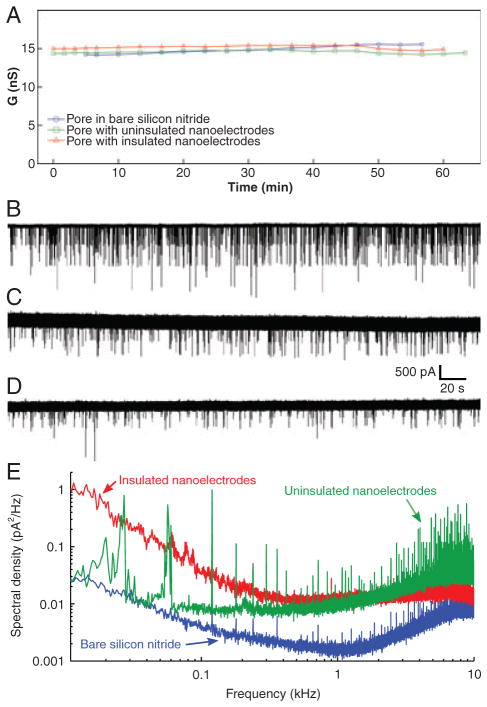
Figure 4.
The presence of nanoelectrodes and insulation do not affect the ionic current through the nanopore (A), or the characteristics of DNA translocation (B–D). (B) Nanopore in a bare silicon nitride membrane without nanoelectrodes, (C) nanopore with uninsulated nanoelectrodes, (D) nanopore with insulated nanoelectrodes. (E) Noise power spectral density plots of the ionic current measured without DNA, for the same nanopore devices as in (A–D). The left-hand regions of the plots that decrease with frequency are 1/f noise, commonly associated with fluctuations in wetting of the nanopore surface. The right-hand regions that increase with frequency are due to the voltage noise of the amplifier scaled by the membrane capacitance. Note that the sharp spikes in these plots are all due to external interference, mainly from switching power supplies in computer equipment. Each spike is confined to a very narrow frequency band, so the spikes do not contribute significantly to the total noise. All measurements were carried out with 120 mV bias voltage, using 1 M KCl, 10 mM Tris, 1 mM EDTA, at pH 8.5–9.0. For DNA translocation experiments, 15 kbp DNA was added to this solution.

