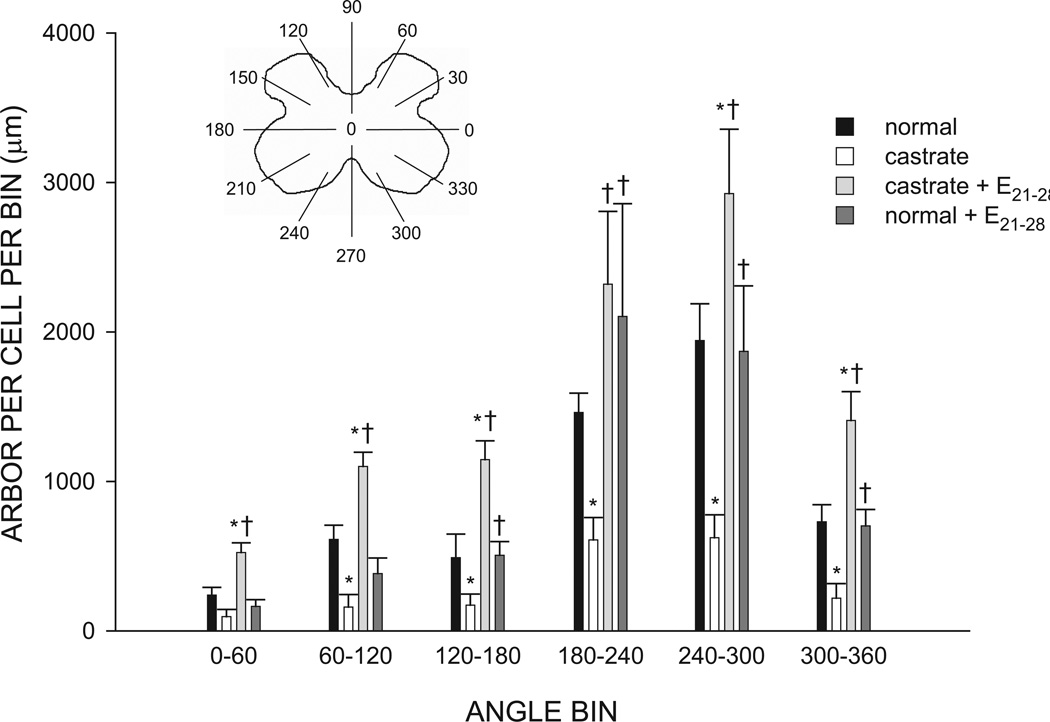
Figure 6.
(Inset) Schematic drawing of spinal gray matter divided into radial sectors for measure of SNB dendritic distribution. Length per radial bin of SNB dendrites at P28 for normal males, untreated castrates (castrate), castrates treated with estradiol implants from P21–P28 (castrate + E21–28), and normal males treated with estradiol from P21–P28 (normal + E21–28). For graphical purposes, dendritic length measures have been collapsed into six bins of 60° each. Bar heights represent means ± SEM for four to seven animals per group. * denotes significantly different from normal males; † indicates significantly different from castrated males.

