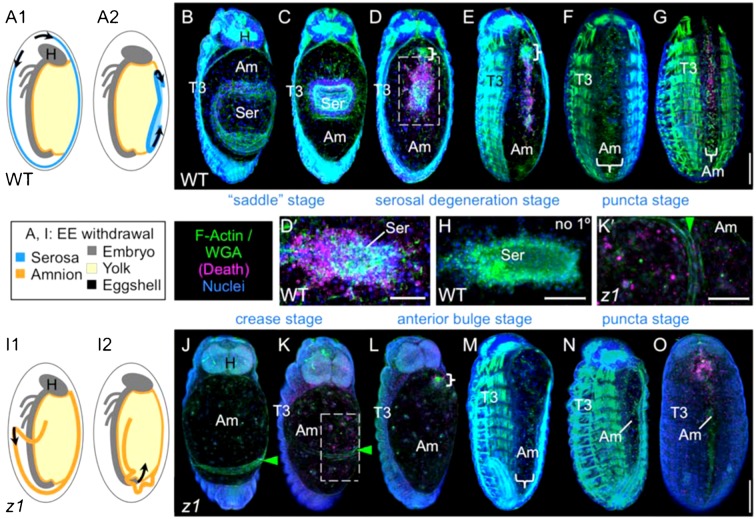
Fig. 1. Overview of Tribolium DC in WT and after Tc-zen1RNAi.
(A–H) WT, (I–O) Tc-zen1RNAi. (A,I) Schematics of excess EE tissue withdrawal progression: EE tissue that had covered the embryo (1) folds onto itself and contracts in the direction indicated by the arrows (2) (sagittal views, color-coding as indicated). (B–G,H,J–O) Confocal projections, dorsal views, where stage names refer to the morphology of the excess EE tissue. Whereas in WT the EE tissue is reduced to a single, planar epithelium only in late DC (F), this topography is attained earlier in Tc-zen1RNAi embryos (L). Compared to WT, the Tc-zen1RNAi amnion has higher levels of early amniotic apoptosis (K,K′), specifically in the region anterior to the tissue crease. Whole mounts are oriented with anterior up; in insets (D′,H,K′) anterior is left. Curly brackets demarcate a small, anterior ‘ball’ structure that occurs in both WT and Tc-zen1RNAi amnions (D,E,L). Green arrowheads mark the Tc-zen1RNAi amniotic crease (J,K). Fluorescent staining reagents are as indicated (see Materials and Methods): F-actin stains are shown in B–G,M,N; WGA stains are shown in H,J–L,O. Apoptosis stain (“death”) is shown in all micrographs except F,M,N, where H shows the no-primary control for the apoptosis antibody. Note that not all pycnotic nuclei are labeled with this antibody. Abbreviations: Am, amnion; H, head; Ser, serosa; T#, thoracic segment #; WT, wild type; z1, Tc-zen1RNAi. Scale bars: 100 µm for whole mounts (shown in G,O), 50 µm for insets. Overviews of DC morphogenesis are also provided in supplementary material Movie 1 (WT) and supplementary material Movie 5 (Tc-zen1RNAi).

