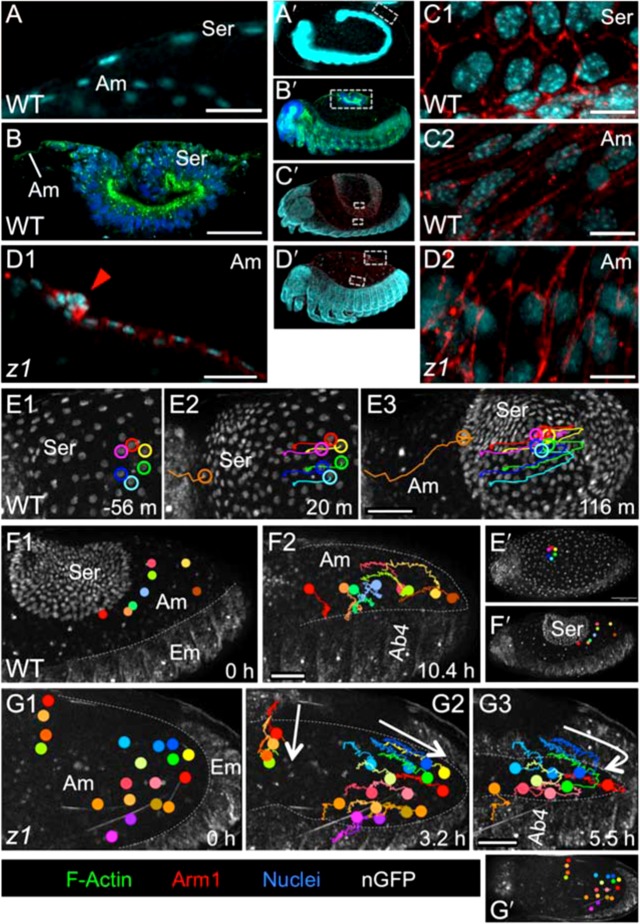
Fig. 2. The serosa and amnion are distinguishable by cellular morphology and rearrangement behavior.
(A,B,C,E,F) WT, (D,G) Tc-zen1RNAi. (A–D) Serosal cells have larger, brighter (more polyploid), more widely spaced nuclei; more hexagonal apical areas; and high levels of apical F-Actin during contraction (A–C). The Tc-zen1RNAi tissue retains amniotic characteristics (D). Stages shown before (A) and during (B,C,D) EE tissue withdrawal, in sagittal (A,B,D1) and surface (C1,C2,D2) views. The arrowhead indicates the Tc-zen1RNAi amniotic crease (D1). (E–G) Nuclear tracking from supplementary material Movies 1, 2 (E,F) and supplementary material Movies 6, 7 (G), where colored dots indicate individual tracked cells' current positions. Serosal cells more rigidly keep their neighbors during tissue reorganization than WT or Tc-zen1RNAi amniotic cells (note crossed pink and green tracks in F2), though overall amniotic cells converge toward the dorsal midline during DC (tracks in F2,G2,G3). See supplementary material Fig. S1 for quantification. Elapsed time is relative to serosal rupture (E) or the first panel shown (F,G). F1 starts 3.9 hours after E1 (same embryo). Dashed lines approximate the amnion–embryo border (F,G). White arrows indicate general trends of tissue reorganization (G2,G3). In whole embryo views (letter-prime panels), regions of interest are indicated by dashed grey boxes or colored dots (E1/F1/G1 and E′/F′/G′ are of the same time point). Images are oriented with anterior left and dorsal up. Visualization reagents are as indicated (B also stained with WGA: cyan). Abbreviations as in previous figure; additionally: Ab#, abdominal segment #; Em, embryo; m, minutes; h, hours. Scale bars: 20 µm (A,D1), 50 µm (B,E1–E3,F1,F2,G1–G3), and 10 µm (C1,C2,D2).

