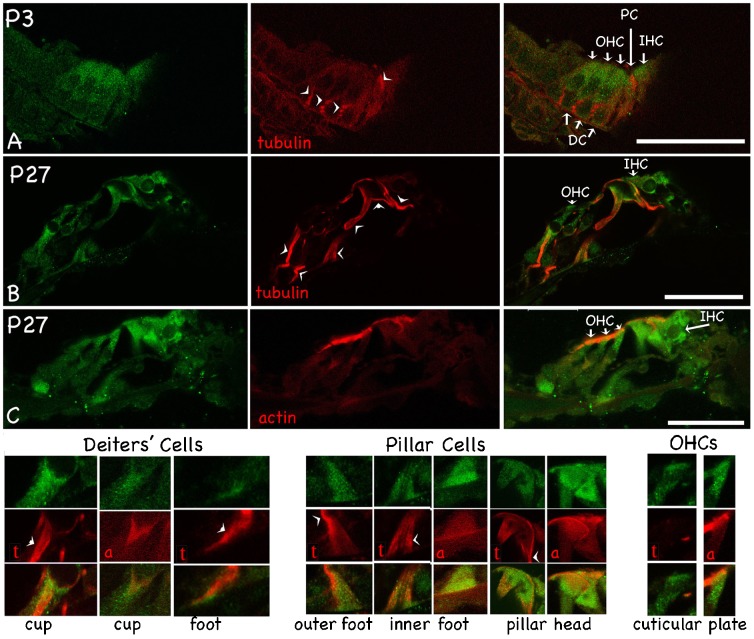
Fig. 2. Immunofluorescent images show protein distribution for marshalin (anti-marshalin, green), MΤ (indicated by red ‘t’ or ‘tubulin’), and actin-filaments (indicated by red ‘a’ or ‘actin’).
(A–B) Organ of Corti derived at P3 (A) and P27 (B) with marshalin/tubulin staining, and a merged image showing both. (C) Organ of Corti derived at P27 with marshalin, actin, and a merged image showing marshalin and actin staining. Enlarged images show the co-localization of marshalin with tubulin or actin at the cup and foot of a Deiters' cell, the feet and heads of pillar cells, and the cuticular plate of an OHC. Scale bar: 24 µm.

