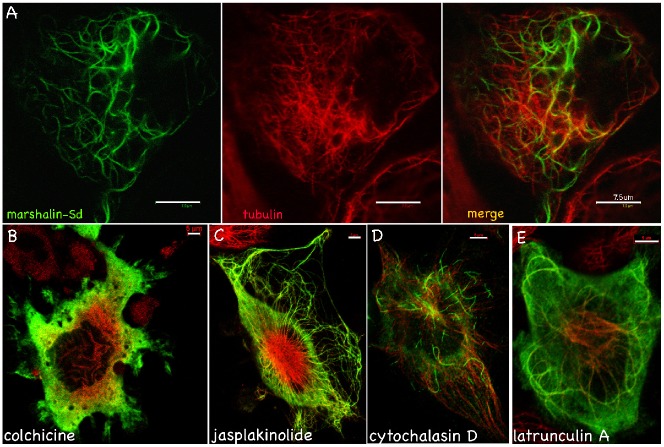
Fig. 8. MT bundles induced by marshalin-Sd cDNA.
Marshalin-Sd-V5-His-expressing OK cells stained with anti-V5 for detecting marshalin (green) and anti-α-tubulin for detecting MTs (red) and merged images showing both 48 hrs post transfection. (A) Cells without drug treatment. Scale bar: 7.5 µm. (B) Cells treated with 250 ng/µl colchicine, a microtubule polymerization inhibitor, for 24 hrs. (C) Cells treated with 10 nM jasplakinolide, which increases actin filament assembly, for 24 hrs. (D) Cells treated with 0.5 µM cytochalasin D, which inhibits actin polymerization, for 24 hrs. (E) Cells treated with 0.25 µM latruculin A for 24 hrs, which also inhibits actin polymerization. Panels B–E are merged images showing both MT and marshalin-Sd staining. Scale bars: 5 µm (B–E).

