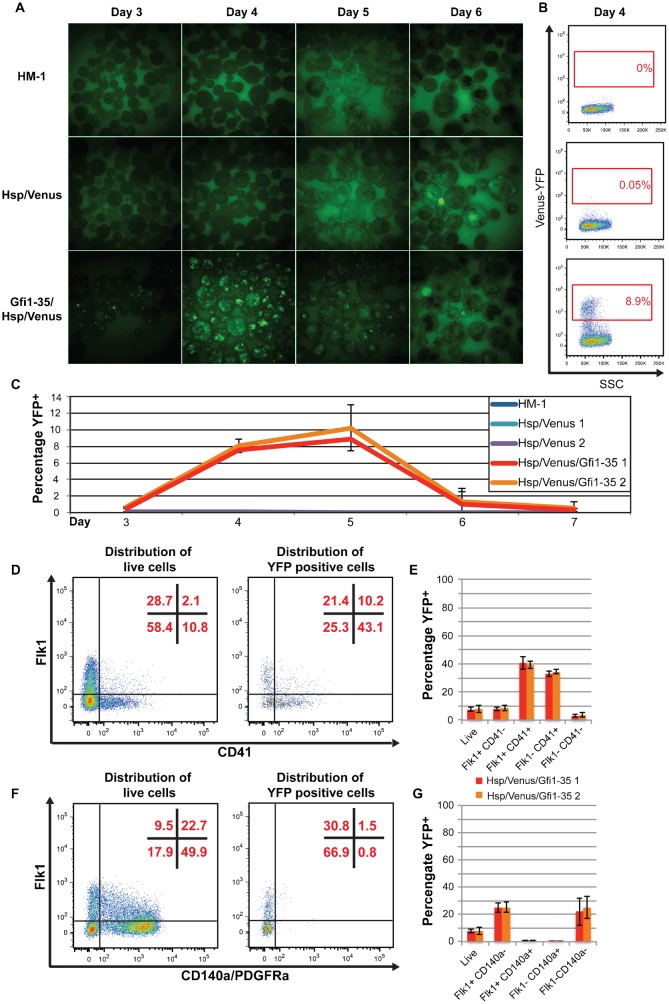
Fig. 2. Gfi1-35 activity marks haematopoietic-fated cells during embryoid body differentiation.
(A) Fluorescent images of day 3–6 EBs from the representative clones of HM-1 (top), Hsp/Venus control (middle) and Gfi1-35/Hsp/Venus (bottom) lines. (B) Representative flow cytometry plots of Venus-YFP vs side scatter (SSC) for HM-1 (top), Hsp/Venus control (middle) and Gfi1-35/Hsp/Venus (bottom) day 4 EB cells with the YFP positive gate, and its percentage of the live cell population, shown in red. (C) Percentage of the YFP positive population (gating shown in B) from day 3–7 for HM-1 (blue), two representative Hsp/Venus control clones (aqua and purple) and two representative Gfi1-35/Hsp/Venus (red and orange) clones, showing average of three independent differentiation experiments ± standard deviation. (D) Representative flow cytometry plots showing distribution of Gfi1-35/Hsp/Venus day 4 EB cells in Flk1/CD41 quadrants for all live cells (left plot) and YFP positive cells only (right plot), with the percentage of cells in each quadrant shown in red. (E) Percentage of YFP positive cells in each of the Flk1/CD41 quadrants of (D) for Gfi1-35/Hsp/Venus (clone 1 in red, clone 2 in orange). Average of three independent differentiation experiments ± standard deviation. (F) As in (D), but for Flk1/CD140a quadrants. (G) As for (E), but for Flk1/CD140a quadrants in (F).

