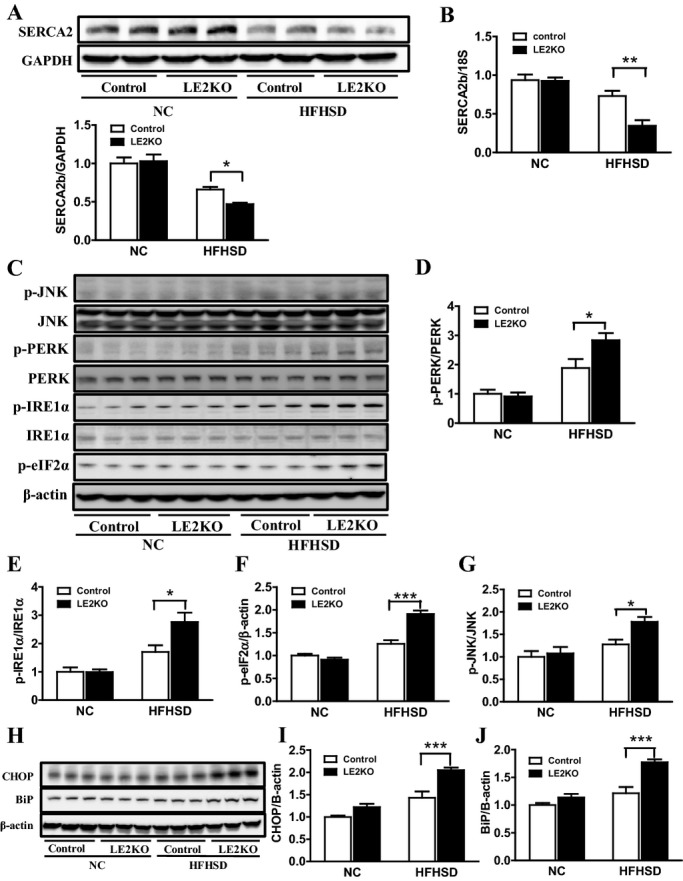
Figure 4.

HFHSD‐fed LE2KO have decreased SERCA2b expression and increased ER stress. (A, B) SERCA2 protein (A) (n=10 for each group) and mRNA levels (B) (n=6 for each group) in the livers of controls and LE2KO on NC or HFHSD, respectively. (C) Phosphorylation of PERK (Thr980), IRE1α (Ser724), eIF2α (Ser51), and JNK (Thr183/Tyr185) in the livers of controls and LE2KO on NC or HFHSD, respectively (n=6 for each group). (D–G) Quantification of phospho‐PERK/PERK (D), phospho‐IRE1α/IRE1α (E), phospho‐eIF2α/β‐actin (F), and phospho‐JNK/JNK ratio (G) (n=6 for each group). (H) CHOP and BiP protein expression levels in the livers of controls and LE2KO on NC or HFHSD, respectively (n=6 for each group). (I, J) Quantification of CHOP/β‐actin (I) and BiP/β‐actin ratio (J). Error bars represent SEM. *P<0.05, **P<0.01, ***P<0.001 vs controls fed HFHSD. BiP indicates immunoglobulin heavy‐chain binding protein; CHOP, C/EBP homologous protein; eIF2α, eukaryotic initiation factor 2α; ER, endoplasmic reticulum; ERK, extracellular signal‐regulated kinase; HFHSD, high‐fat/high‐sucrose diet; IRE1α, inositol‐requiring enzyme 1α; JNK, c‐Jun N‐terminal kinase; LE2KO, liver‐specific ERK2 knockout mice; NC, normal chow; PERK, PER‐like ER kinase.
