
Figure 2.
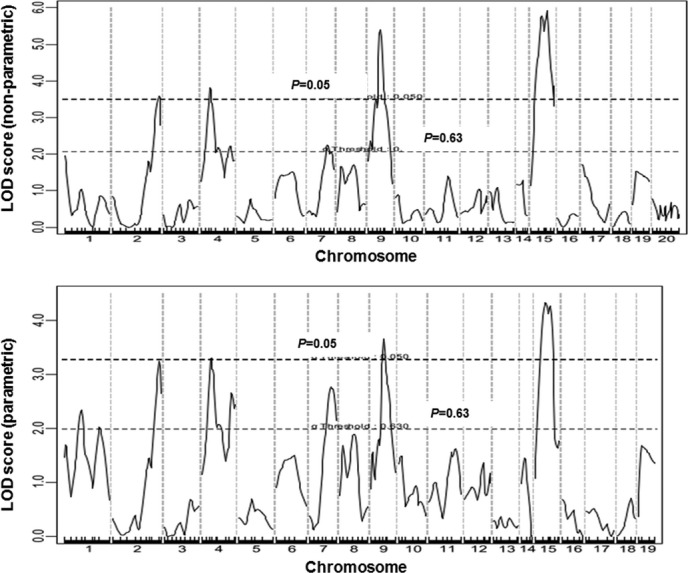
Genomewide QTL analysis to search for loci influencing atherosclerotic lesion sizes in male F2 mice. Chromosomes 1 through 20 are represented numerically on the x axis. The relative width of the space allotted for each chromosome reflects the number of microsatellite markers typed for that chromosome. The y axis represents the LOD score. Two horizontal dashed lines denote genomewide thresholds for suggestive (P=0.63) and significant (P=0.05) linkage. The top panel shows a genomewide scan for atherosclerotic lesions using the nonparametric mode, and the bottom panel shows an autosome scan for atherosclerotic lesions using the parametric mode. For the latter scan, the X chromosome was not included due to a strong biased influence from the chromosome. QTL indicates quantitative trait locus; LOD, logarithm of odds.