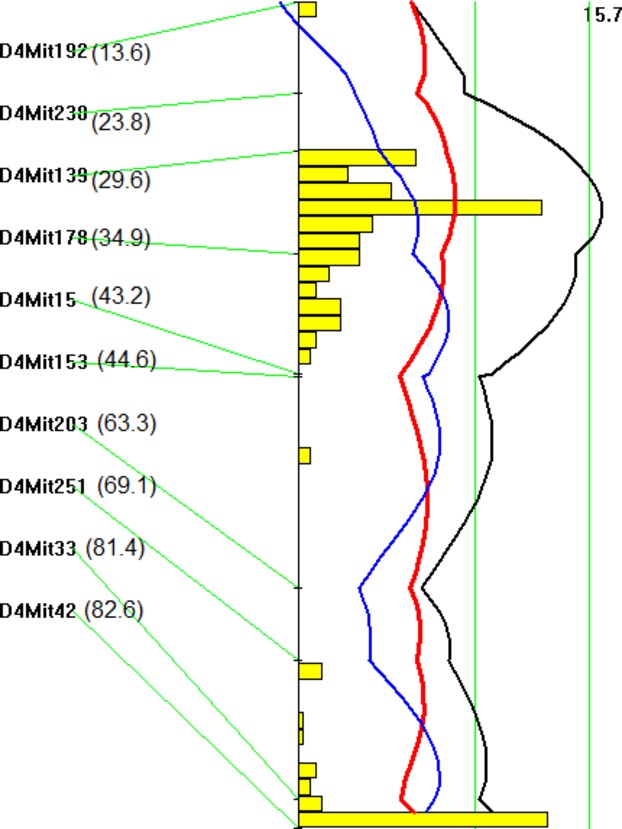
Figure 3.

Interval mapping plot for atherosclerotic lesions on chromosome 4. The plot was created with the interval mapping function of Map Manager QTX, which includes a bootstrap test shown as a histogram estimating the CI of a QTL. Two straight vertical lines on the plot represent the genomewide significance thresholds for suggestive and significant linkage. The black line denotes the LOD score calculated at 1‐cM intervals. The blue line represents the effect of the B6 allele, and the red line represents the effect of the C3H allele. The histogram indicates the existence of 2 QTLs on the chromosome. The number in the bracket denotes the mapping distance from the centromere of a specific marker in cM. LOD indicates logarithm of odds; QTL, quantitative trait locus.
