
Figure 4.
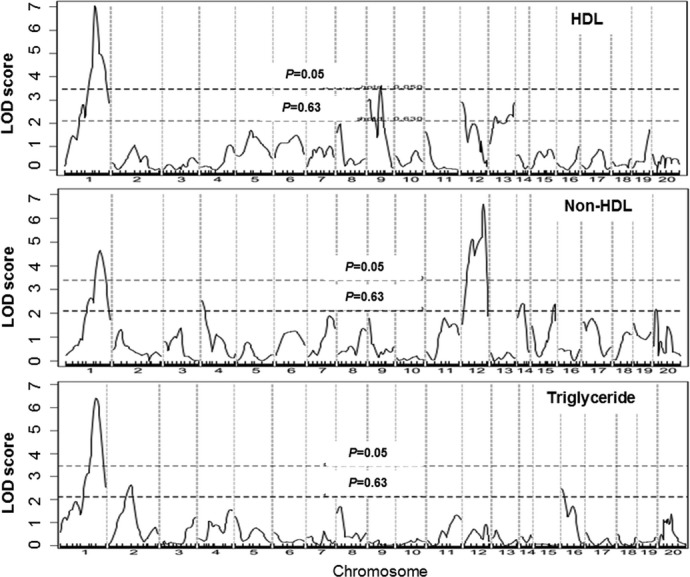
Genomewide scans for HDL, non‐HDL cholesterol, and triglyceride levels in the F2 population. Chromosomes 1 through 20 are represented numerically on the x axis, and the y axis represents the LOD score. Two horizontal dashed lines denote genomewide thresholds for suggestive and significant linkage. LOD indicates logarithm of odds; HDL, high‐density lipoprotein.