
Figure 3.
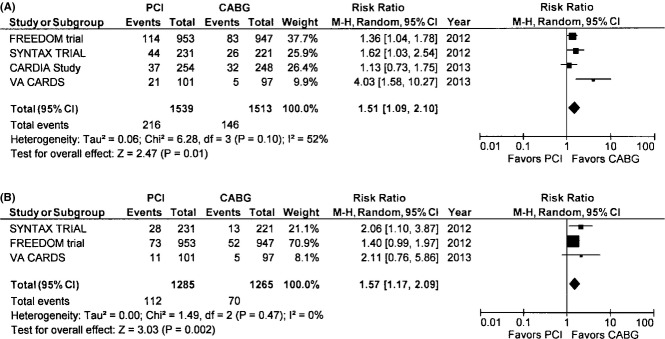
A, Death—The Forest plot depicts the individual trials and subtotal risk ratios and 95% CIs comparing the outcome of death for percutaneous coronary intervention (PCI) vs coronary artery bypass graft surgery (CABG). B, Cardiac death—The Forest plot depicts the individual trials and subtotal risk ratios and 95% CIs comparing the outcome of cardiac death for PCI vs CABG. MH indicates Mantel–Haenszel.