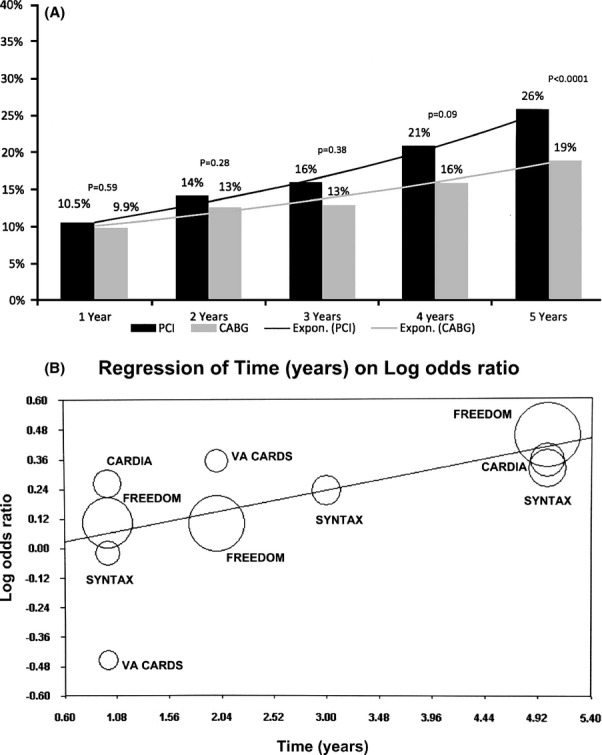
Figure 6.

A, Pooled (MH RR) MACE events at follow‐up—Differences in pooled incidence (random‐effects analysis) of MACE at different time points for percutaneous coronary intervention (PCI) vs coronary artery bypass graft surgery (CABG). B, Meta regression of time over log odds ratio for MACE—Meta regression plot for log odds ratio of MACE for PCI vs CABG as a function of time (in years). Markers above the regression line favor CABG and below the line favor PCI. The size of the data markers represents the weight of each trial. MH indicates Mantel–Haenszel; RR, risk ratio; MACE, major adverse cardiac events.
